Home / Articles Day trading articles. Find the explanation you need. Browse the basics, explore a method, or understand the risk behind a strategy.
Read a series Candlestick Reading for Beginners Price Action: Trends, Pullbacks & Reversals 46 articles
Filter articles All subjects 46 Trading basics 5 Charts & candlesticks 26 Entry techniques 10 Stops & exits 5 Filter by difficulty All levels Beginner Intermediate Filter by tag All tags Candlesticks Chart basics Chart patterns Execution Moving averages Order types Position sizing Price action Risk management Stop losses Support and resistance Timeframes Trade management Trading basics Trading costs Trading plans Trading ranges Trends
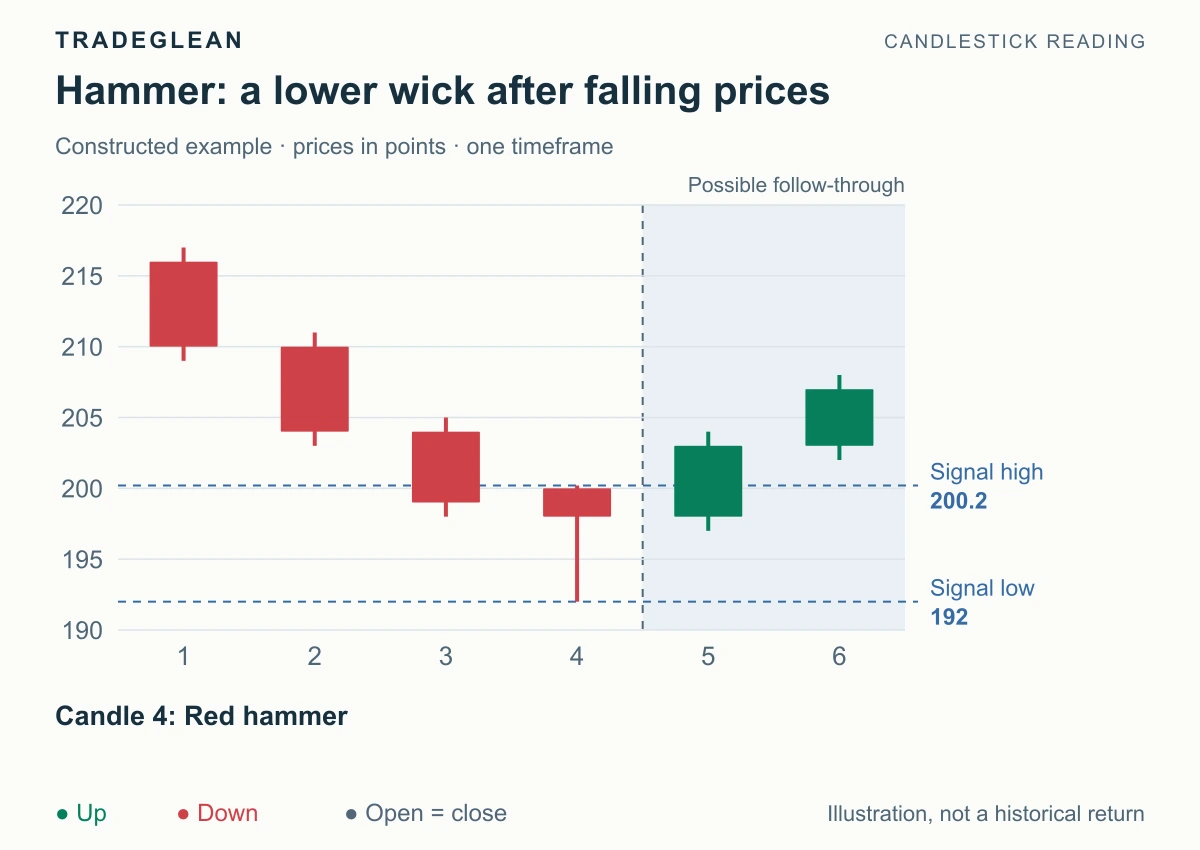
Charts & candlesticks Compare a hammer and shooting star with measured candle examples. Learn which wick matters, how the prior move changes the name, and why color alone is insufficient.
Beginner Oct 7, 2026 6 min read By Adrian
Read article Trading basics Compare buy and sell stop orders with limit orders on one quote sequence. See when each can fill, why a stop price is not a fill price, and how stop-limit orders differ.
Beginner Oct 7, 2026 6 min read By Adrian
Read article Stops & exits Use a simple paper-trading routine to record a setup, entry rule, cancellation point, costs, and review before risking real money.
Beginner Sep 15, 2026 4 min read By Adrian
Read article Trading basics Understand what each order controls, how a trigger differs from a fill, and why a stop order cannot guarantee your exit price.
Beginner Sep 14, 2026 4 min read By Adrian
Read article Charts & candlesticks Give the larger and smaller charts different jobs, use completed candles, and avoid changing timeframes to rescue a failed setup.
Beginner Sep 14, 2026 4 min read By Adrian
Read article Stops & exits Distinguish a planned target ratio from average realized outcomes, calculate break-even win rates, and account for trading costs.
Beginner Sep 14, 2026 4 min read By Adrian
Read article Trading basics Work from actual entry and exit prices, separate spread from commission, and see how costs change a small intraday move.
Beginner Sep 14, 2026 3 min read By Adrian
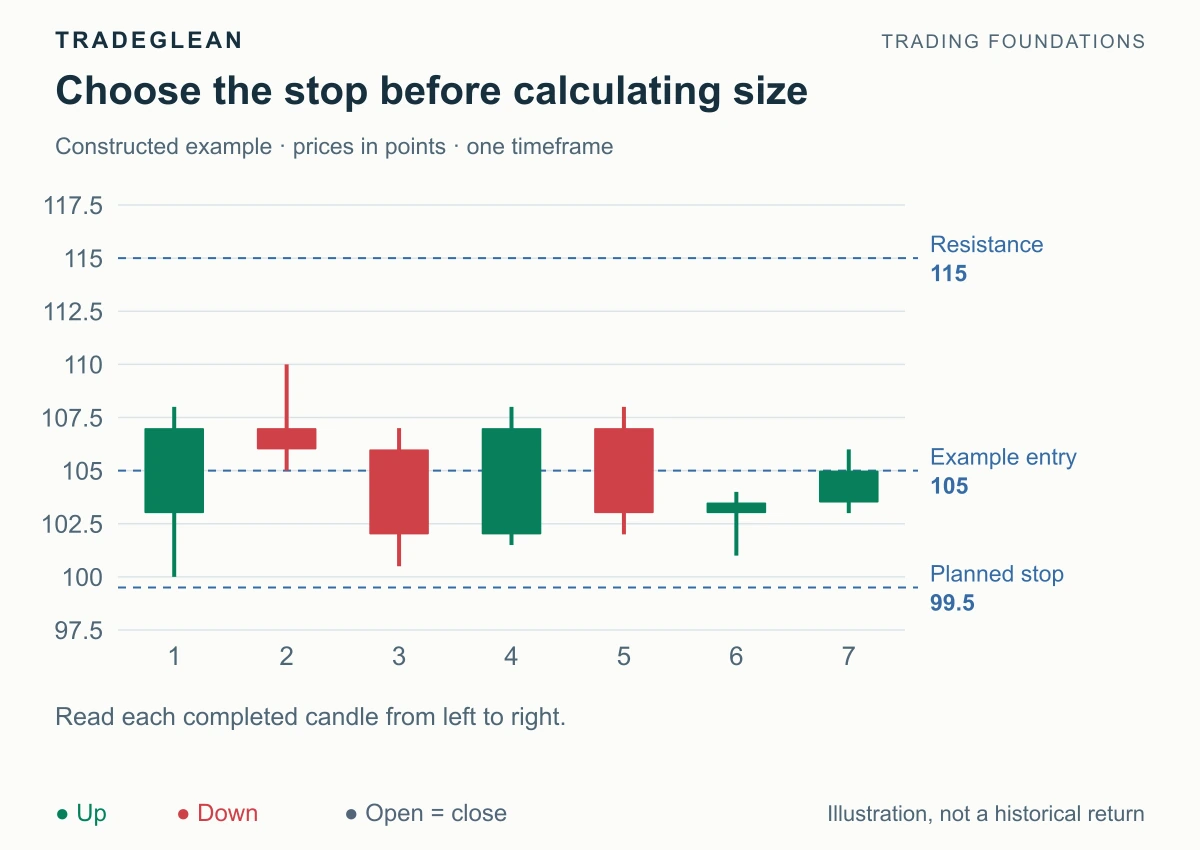
Read article Stops & exits Choose a structural failure reference, translate its distance into money, and round quantity down without treating the stop as a loss guarantee.
Beginner Sep 14, 2026 4 min read By Adrian
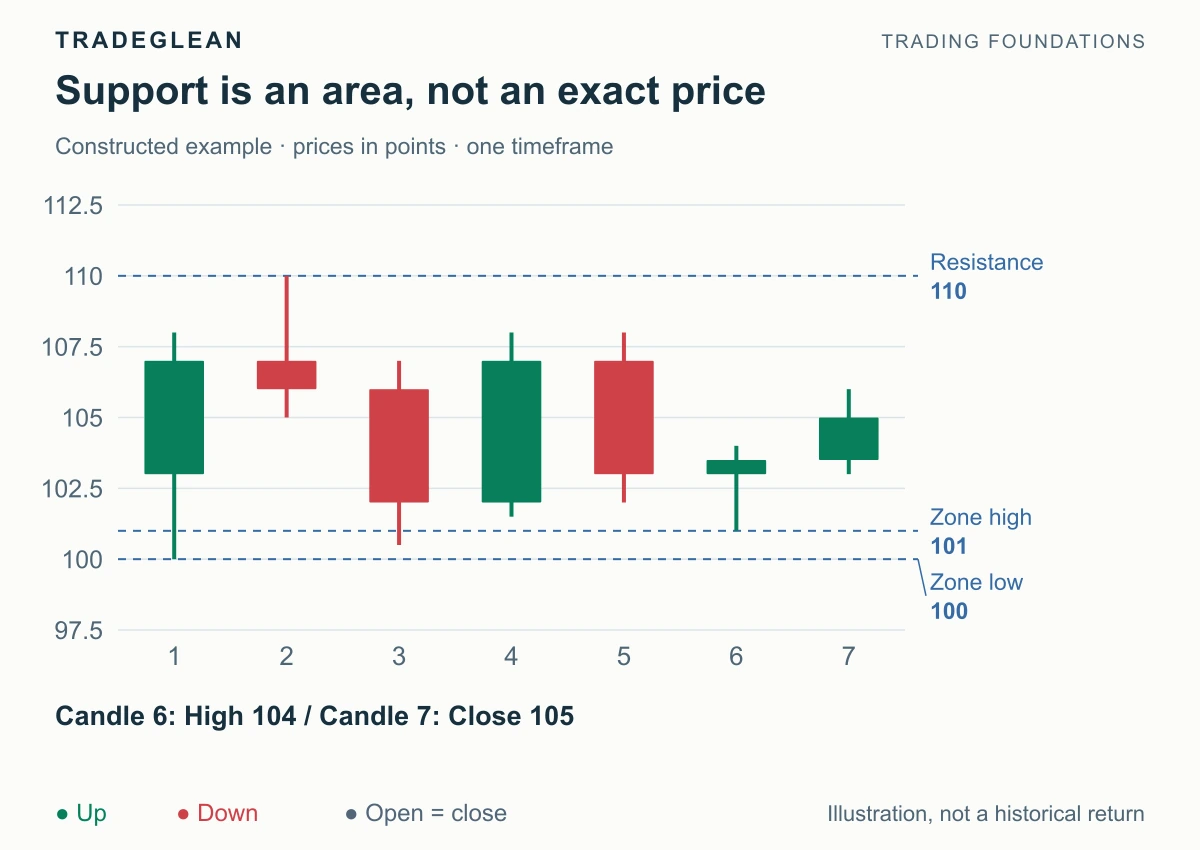
Read article Charts & candlesticks Use visible swing reactions to mark support and resistance, distinguish a touch from a rejection, and define when a level has failed.
Beginner Sep 14, 2026 4 min read By Adrian
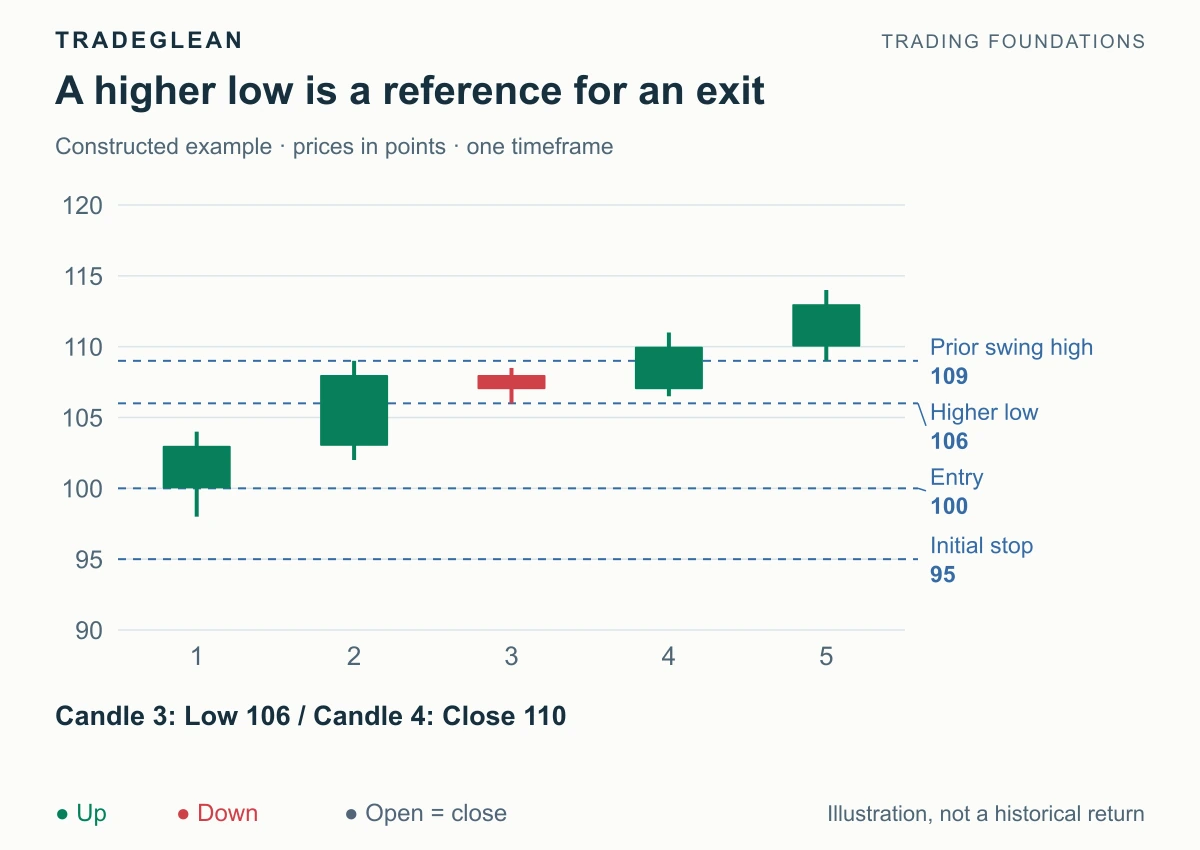
Read article Stops & exits Compare three ways to exit a trade, calculate partial-position outcomes, and distinguish a normal pullback from a failed entry premise.
Beginner Sep 14, 2026 4 min read By Adrian
Read article Charts & candlesticks Distinguish directional progress from repeated overlap, recognize a transition, and choose a method that fits the current market structure.
Beginner Sep 14, 2026 4 min read By Adrian
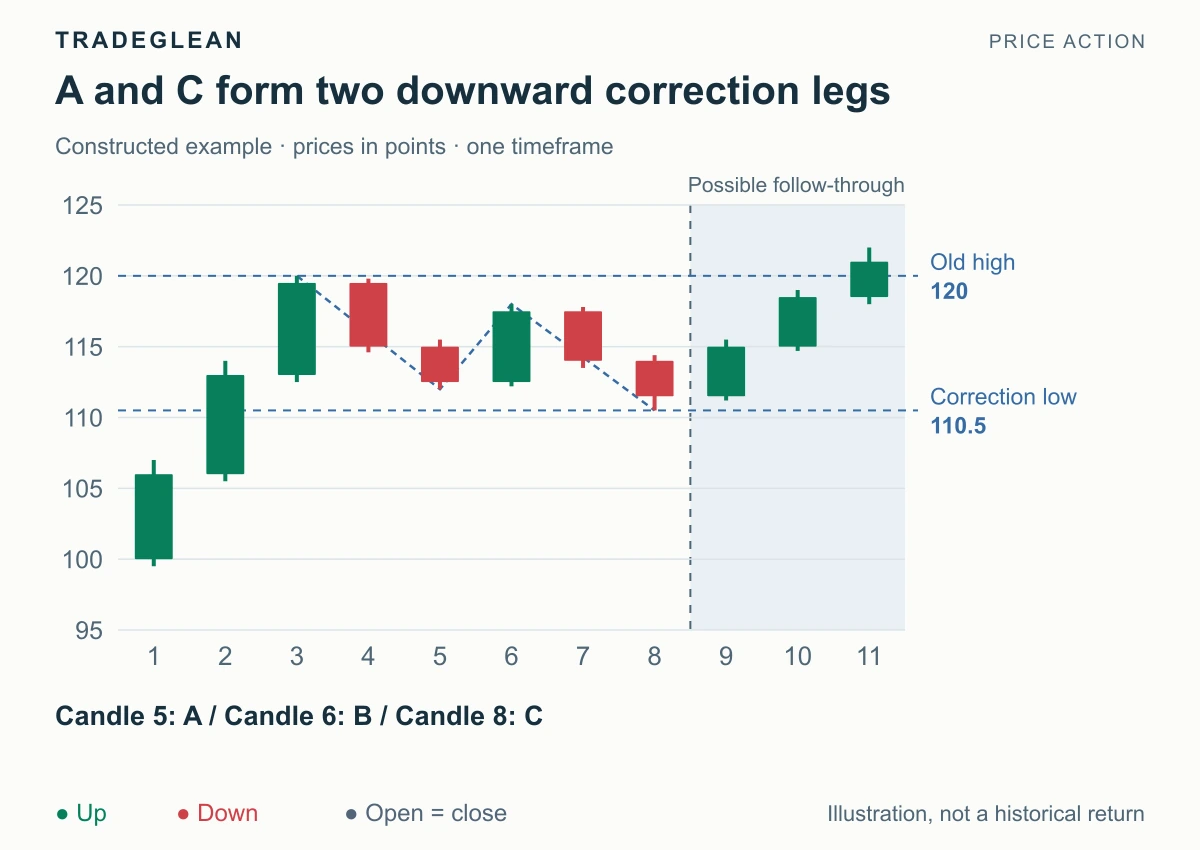
Read article Charts & candlesticks Identify a complex pullback, compare it with a simple correction or reversal, and read ABC legs, confirmation levels, and remaining reward versus risk.
Intermediate Sep 13, 2026 7 min read By Adrian
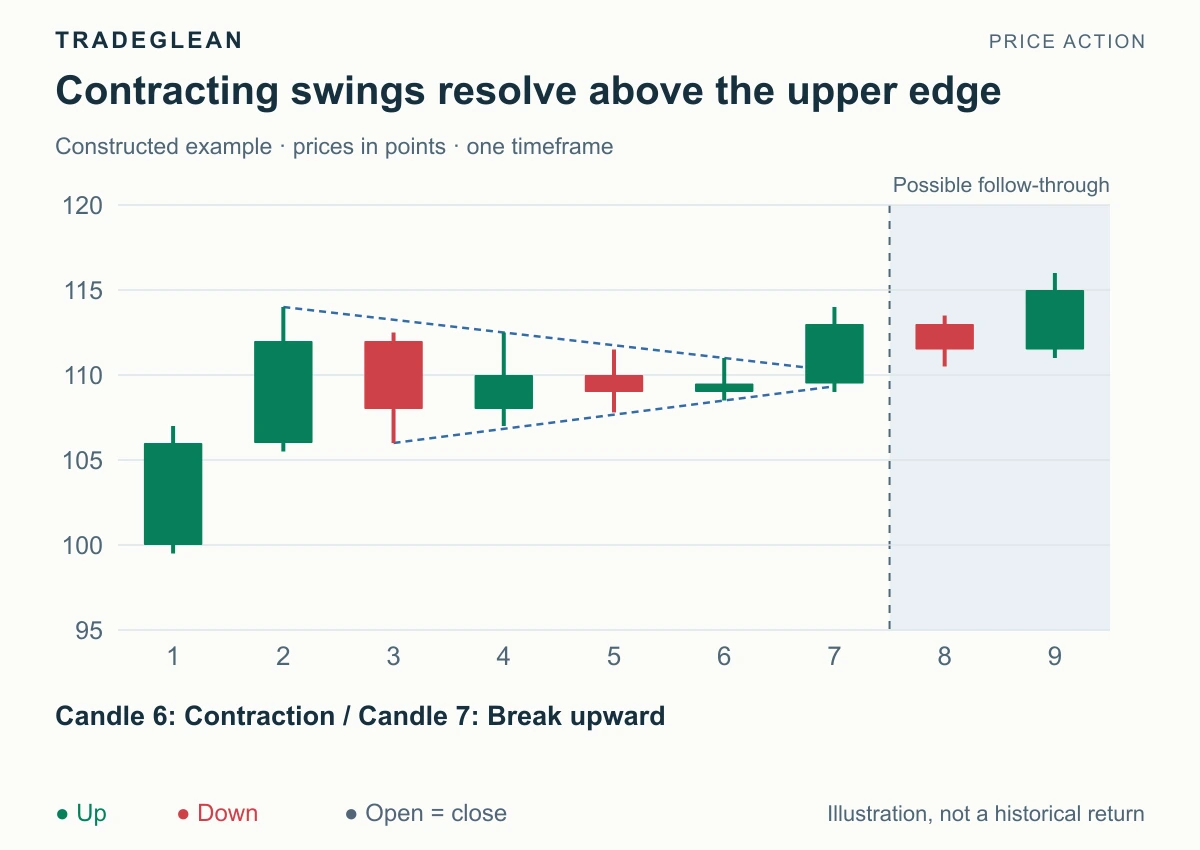
Read article Charts & candlesticks Distinguish contracting and expanding price structures, identify their actual boundaries, and read the confirmed breakout without guessing from the outline.
Intermediate Sep 13, 2026 5 min read By Adrian
Read article Trading basics Understand how an intraday trade works: long and short positions, order types, spreads, trading costs, and the difference between margin and risk.
Beginner Sep 13, 2026 5 min read By Adrian
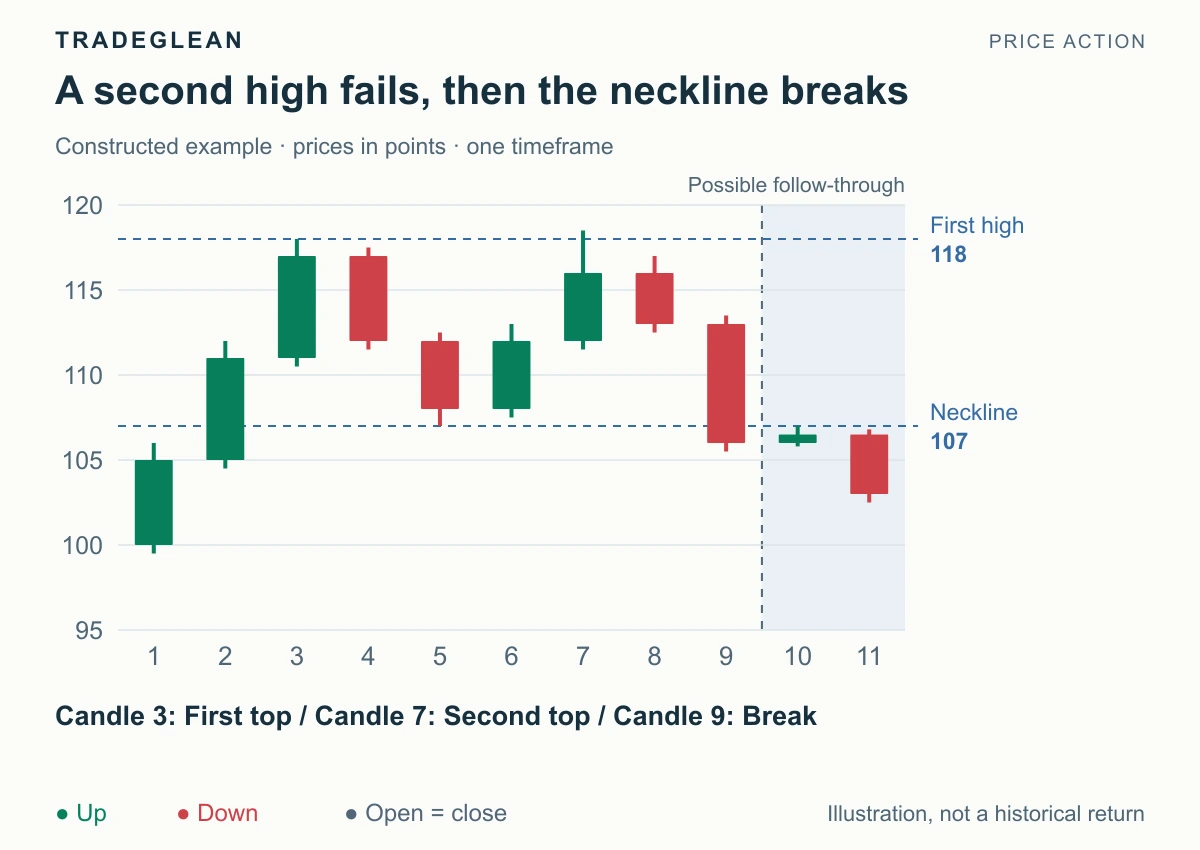
Read article Charts & candlesticks Recognize double tops and double bottoms, distinguish a second test from a completed reversal, and locate the neckline that confirms the direction.
Beginner Sep 13, 2026 4 min read By Adrian
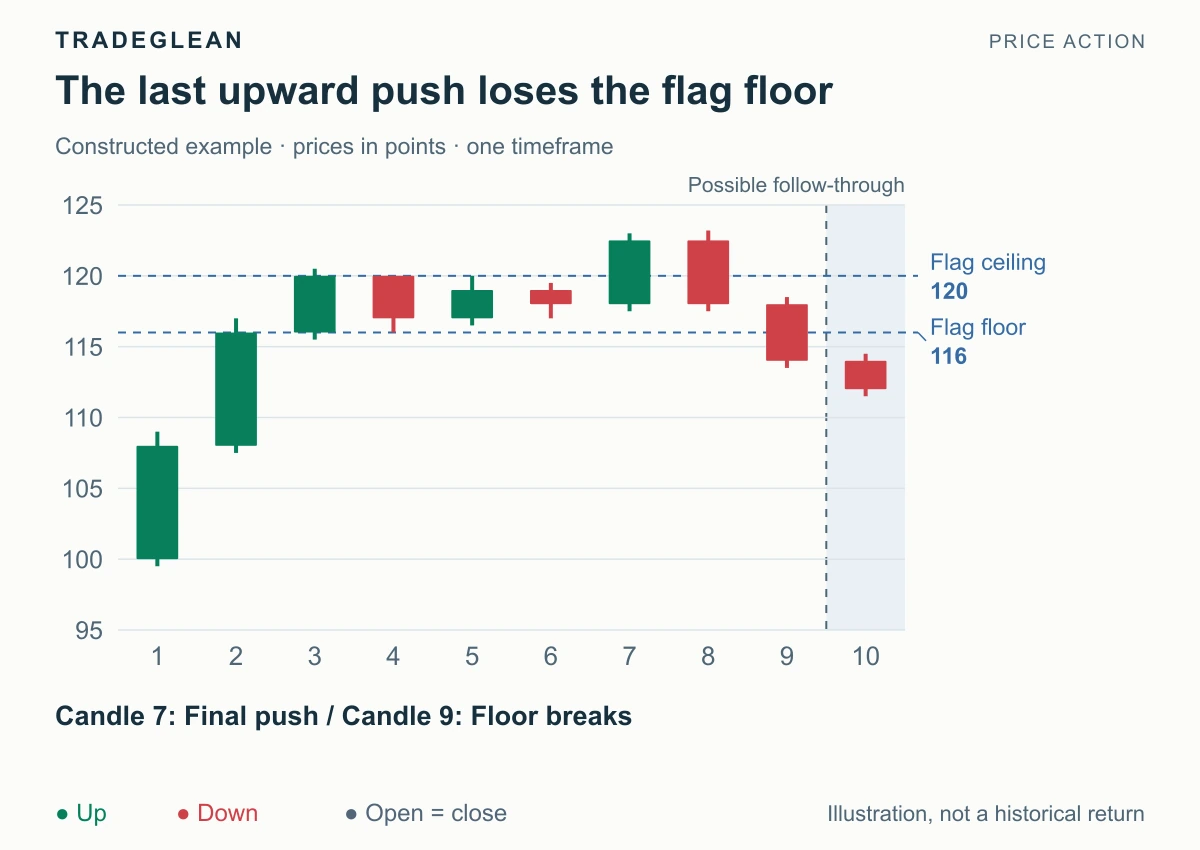
Read article Entry techniques Recognize a final-flag reversal through a pause, one more trend extension, and a confirmed return through the flag's opposite boundary.
Intermediate Sep 13, 2026 4 min read By Adrian
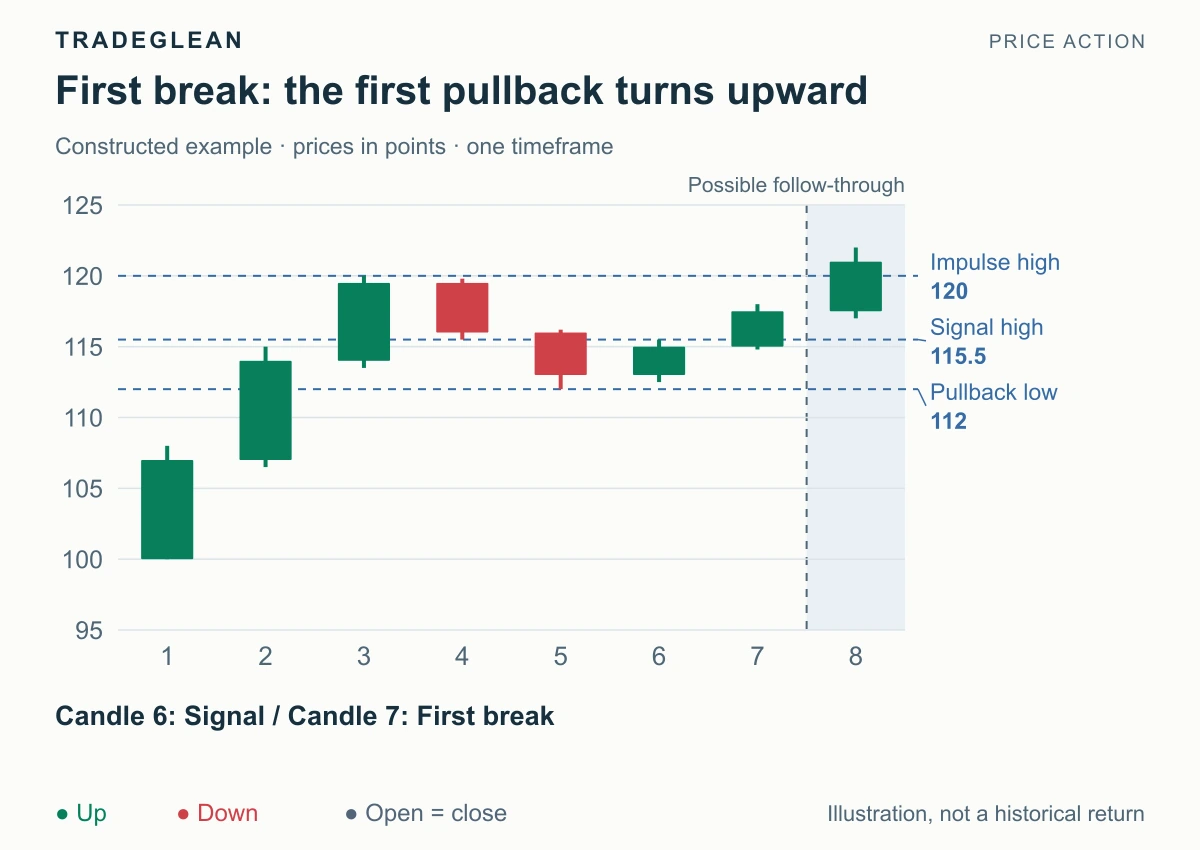
Read article Entry techniques Distinguish FB and SB pullback setups, identify first and second trend-recovery attempts, and compare their confirmation, location, and failure boundaries.
Intermediate Sep 13, 2026 6 min read By Adrian
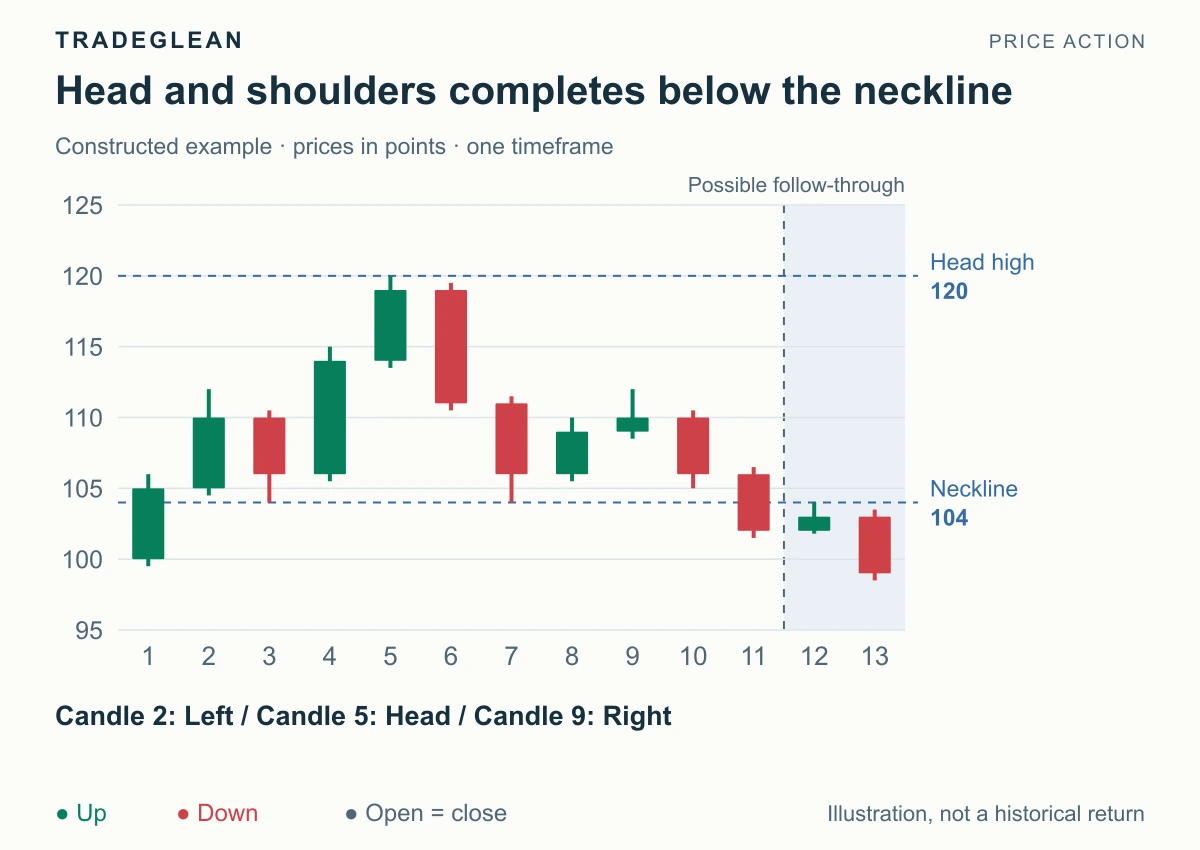
Read article Charts & candlesticks Identify head-and-shoulders tops and bottoms through their pivots and neckline, then distinguish the completed reversal from an unfinished outline.
Intermediate Sep 13, 2026 4 min read By Adrian
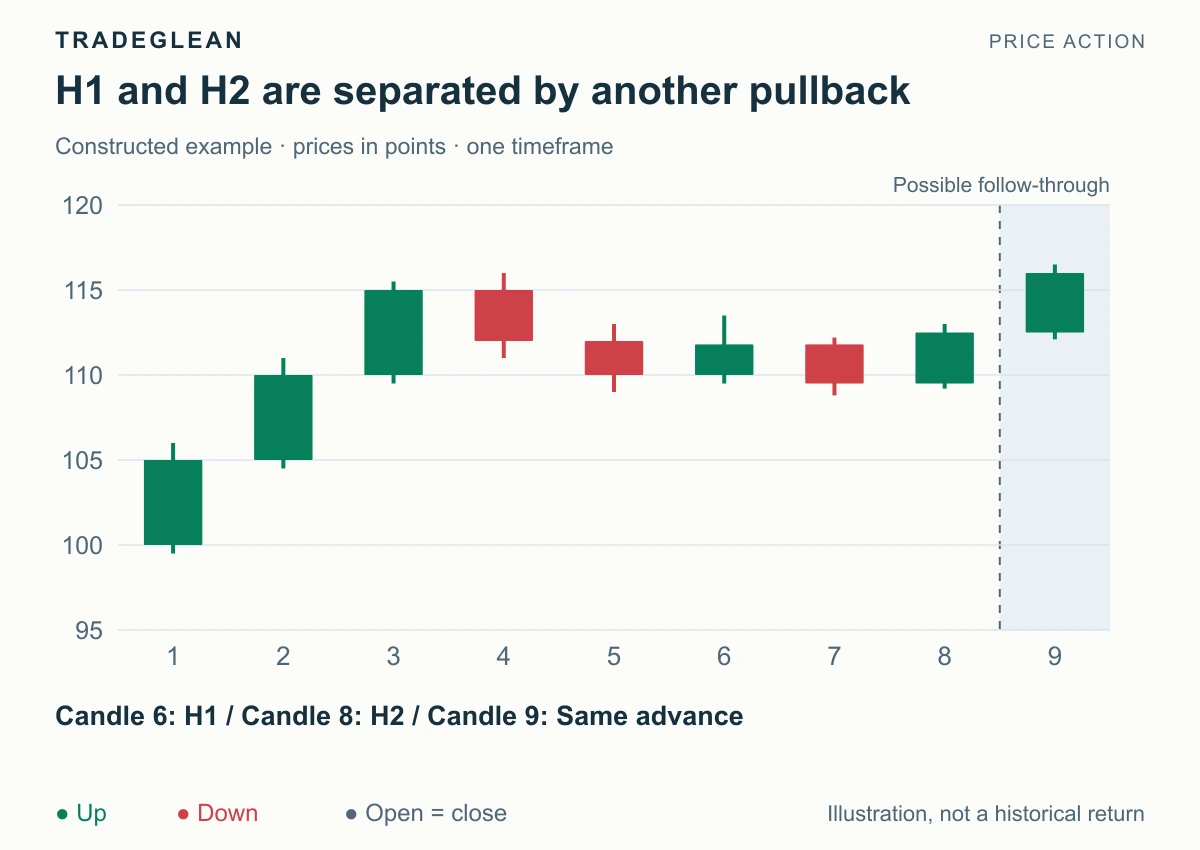
Read article Entry techniques Learn to count first and second attempts to resume a trend, distinguish a trigger from a swing high, and reset the count when the pullback ends.
Intermediate Sep 13, 2026 5 min read By Adrian
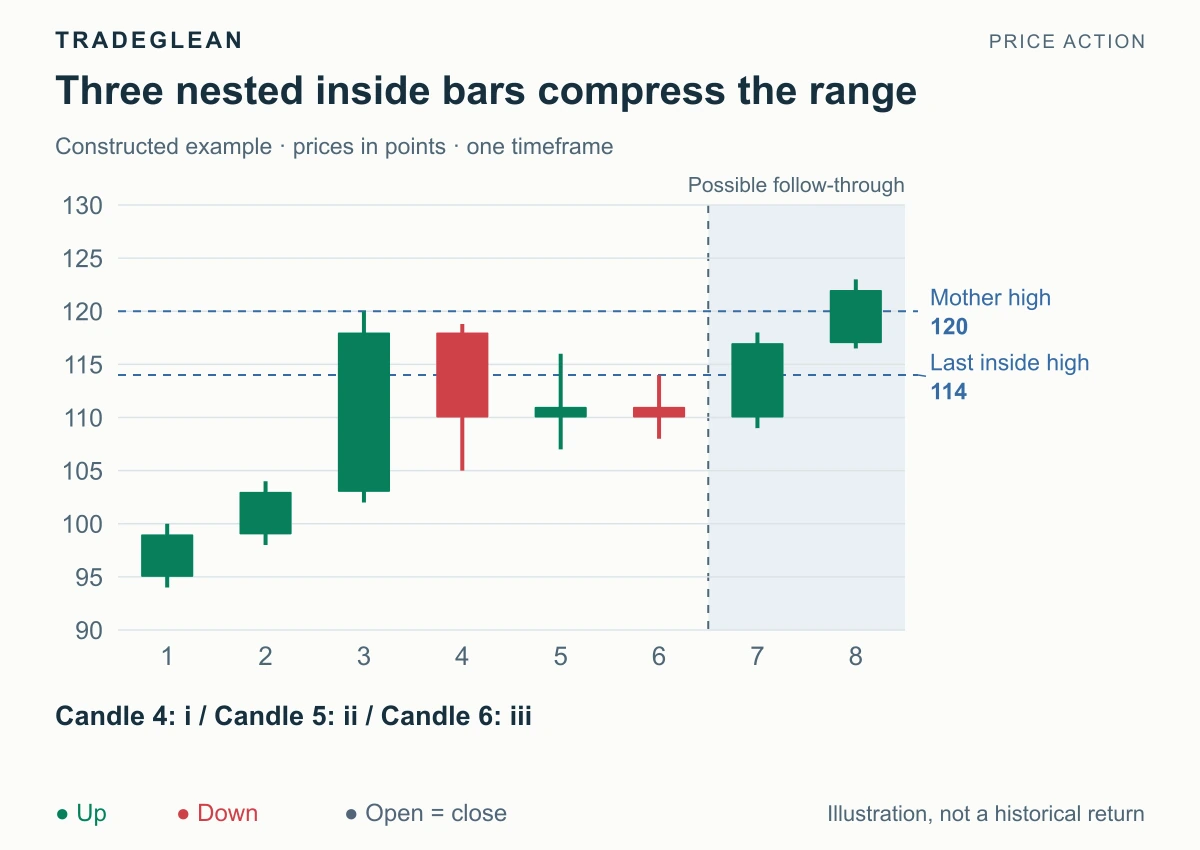
Read article Charts & candlesticks Count nested inside bars and inside-outside-inside sequences, mark their inner and outer boundaries, and connect a breakout to the surrounding trend.
Intermediate Sep 13, 2026 5 min read By Adrian
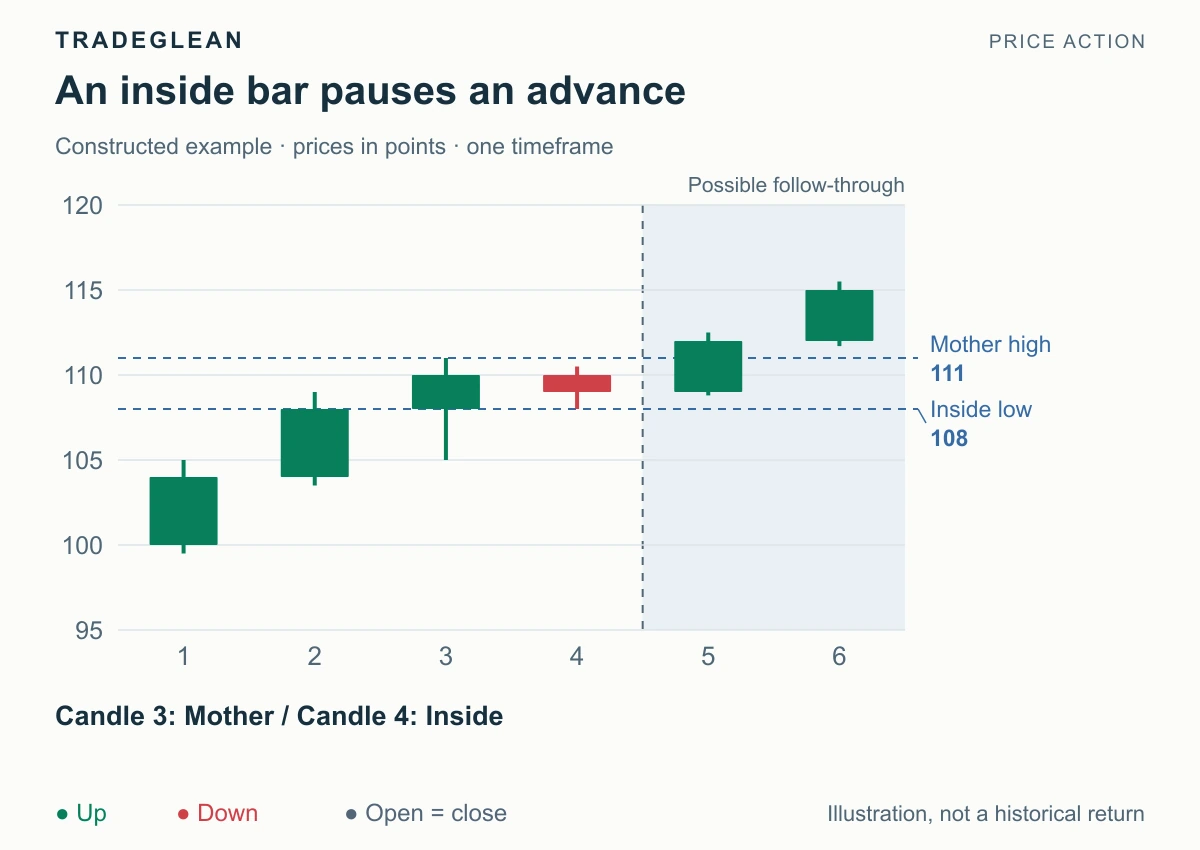
Read article Charts & candlesticks Identify inside and outside bars using complete highs and lows, distinguish them from body engulfing, and use context to choose a directional setup.
Beginner Sep 13, 2026 5 min read By Adrian
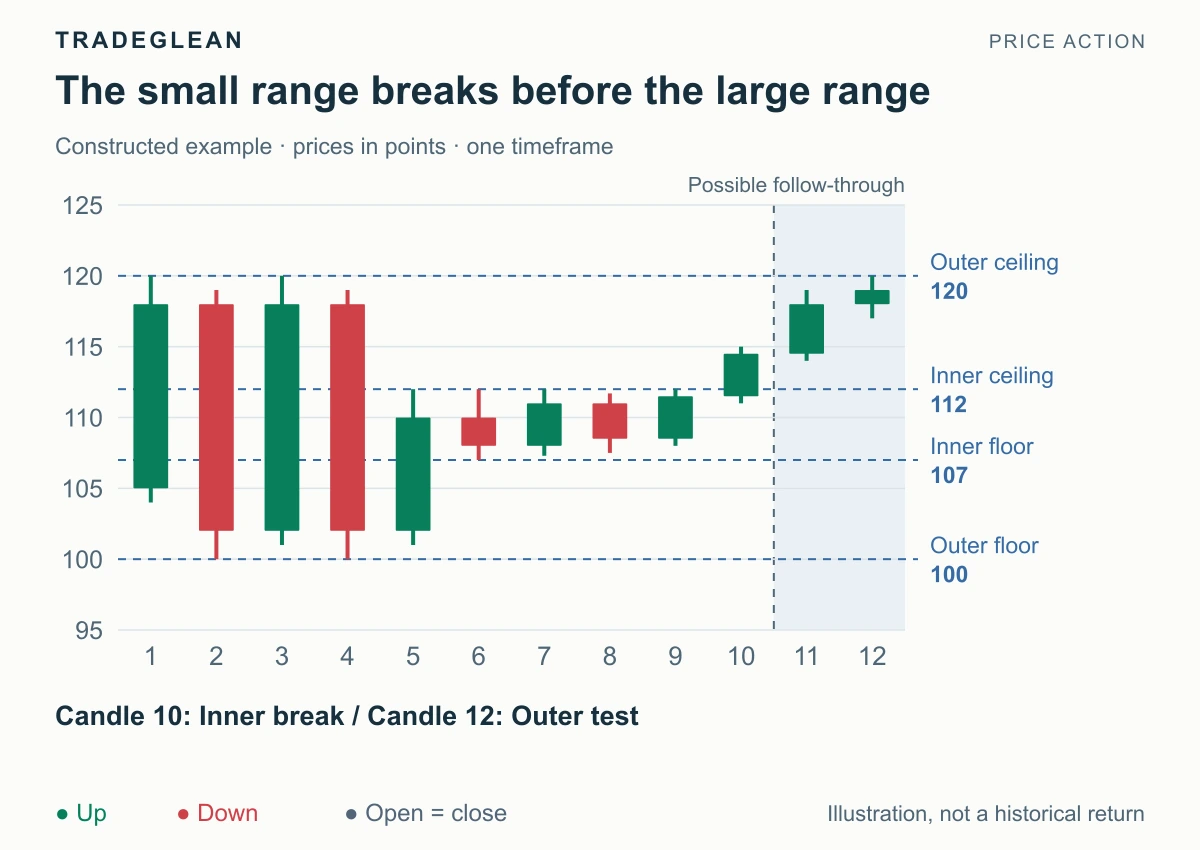
Read article Entry techniques Recognize an inside range break, distinguish inner and outer boundaries, and use a shallow handle without mistaking it for a full range breakout.
Intermediate Sep 13, 2026 4 min read By Adrian
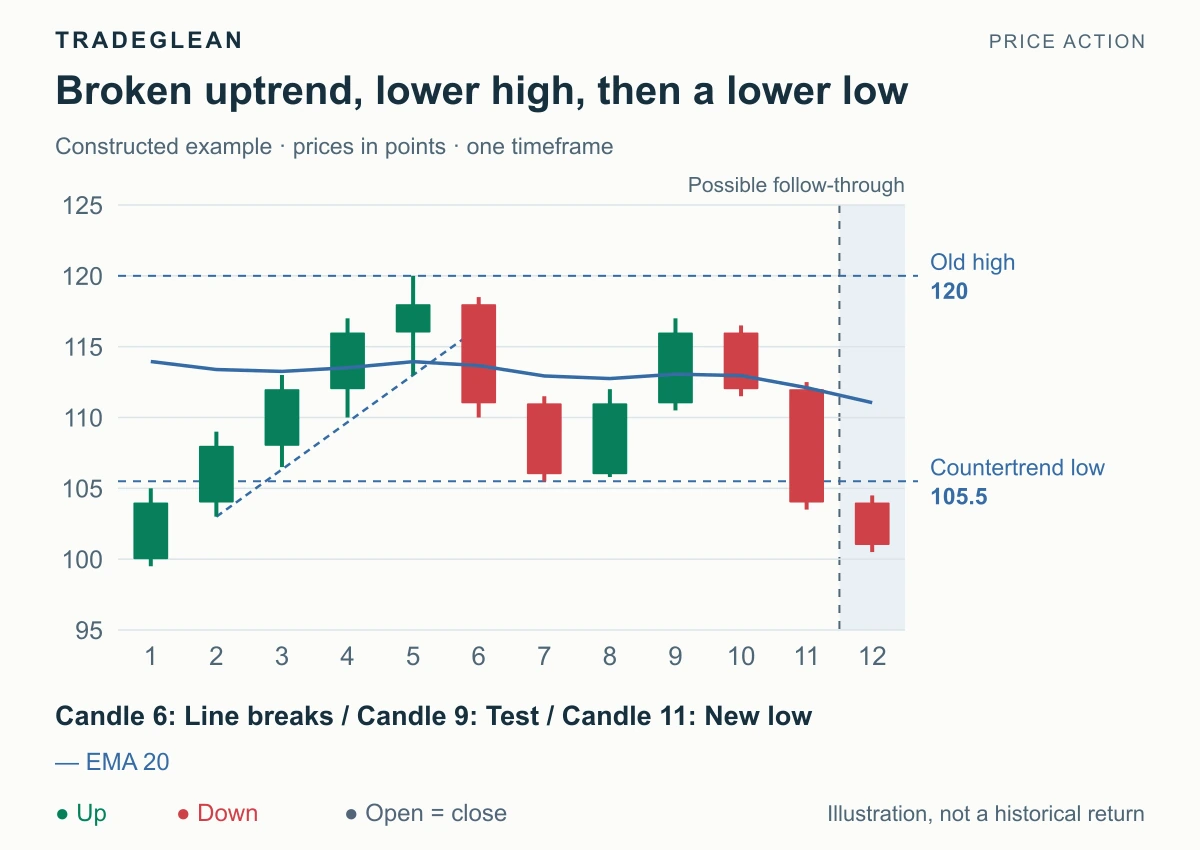
Read article Entry techniques Identify a major trend reversal through a broken trend, a test of the old extreme, and renewed opposite movement, with a precise EMA gap-bar definition.
Intermediate Sep 13, 2026 4 min read By Adrian
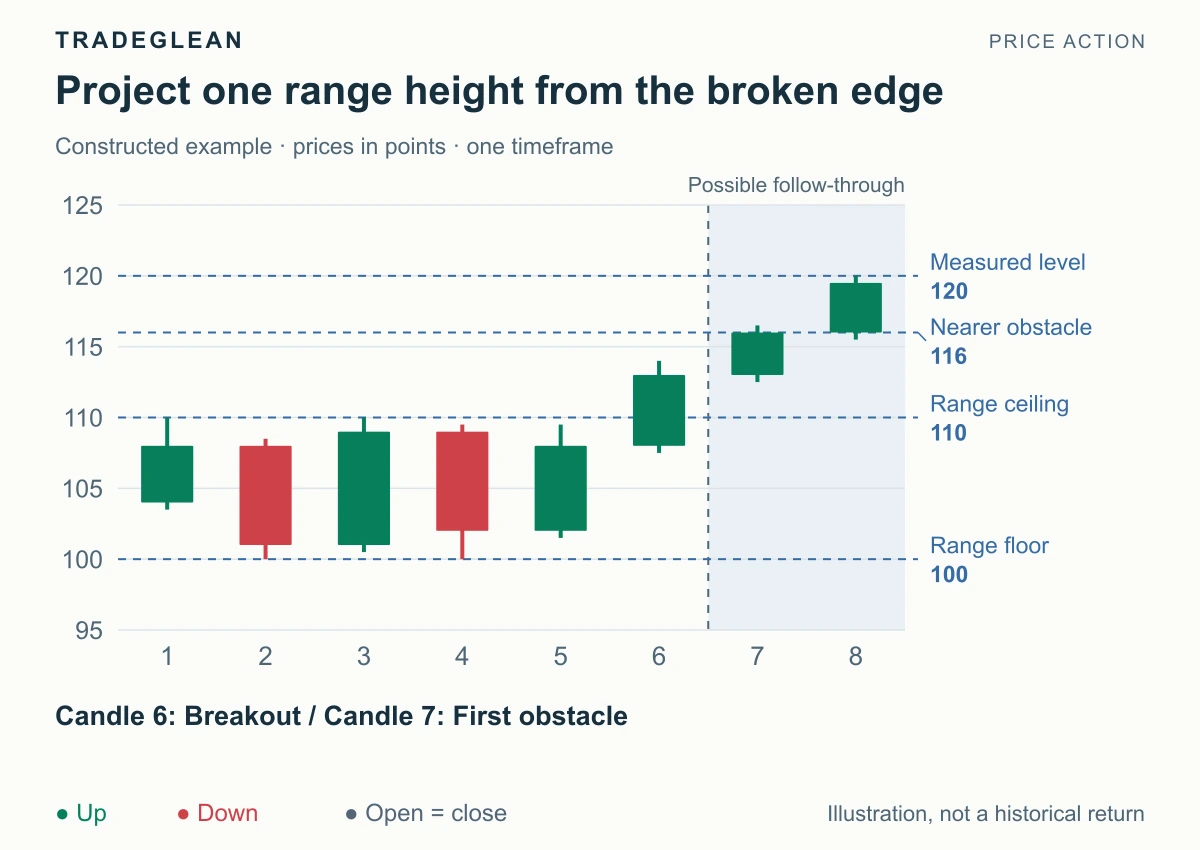
Read article Charts & candlesticks Calculate range-height, equal-leg, and head-height projections with clear starting points, then compare each target with the nearest visible obstacle.
Intermediate Sep 13, 2026 5 min read By Adrian
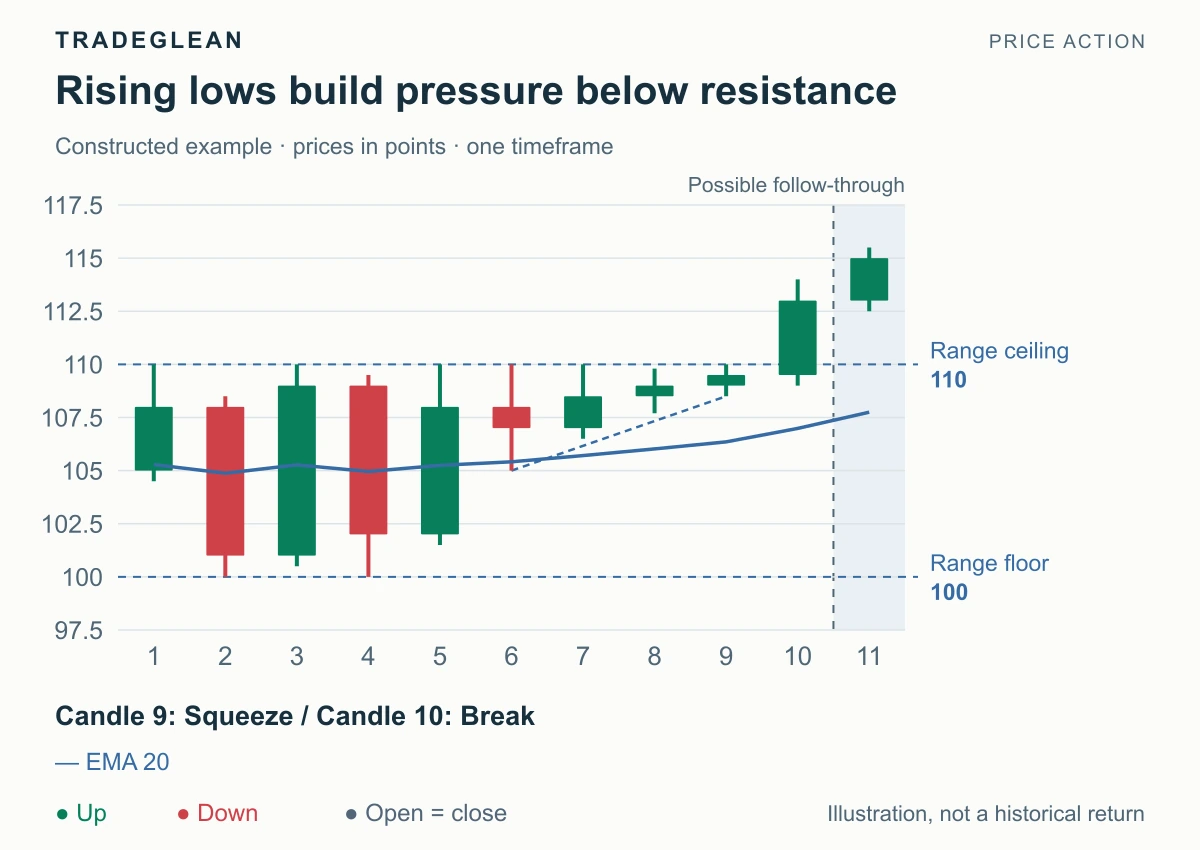
Read article Entry techniques Identify a range-break squeeze, read rising lows or falling highs near the boundary, and separate the directional setup from a confirmed breakout.
Intermediate Sep 13, 2026 5 min read By Adrian
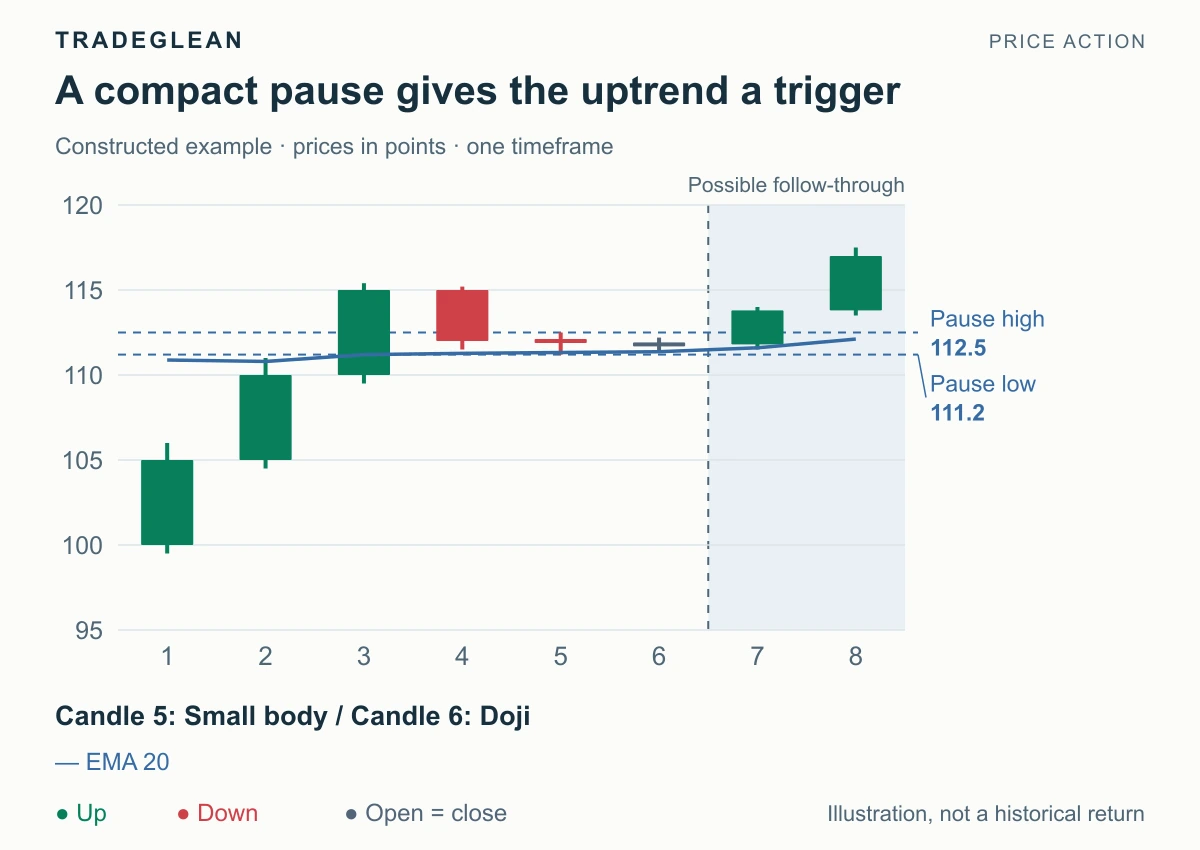
Read article Entry techniques Recognize an orderly pullback in a strong trend, locate a compact pause, and wait for a closing break before treating it as a trend restart.
Beginner Sep 13, 2026 6 min read By Adrian
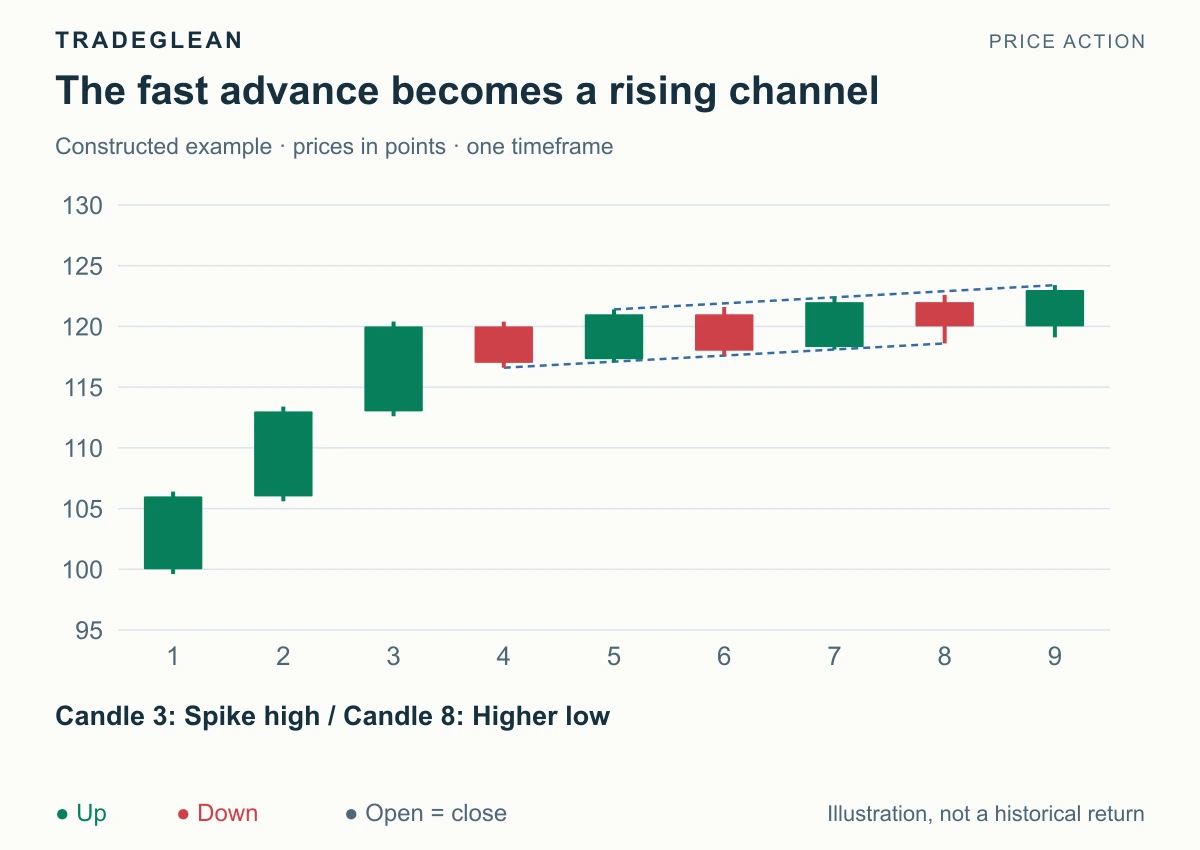
Read article Charts & candlesticks Distinguish a fast impulse followed by a channel from a trend built through successive ranges, and recognize when directional progress starts to weaken.
Beginner Sep 13, 2026 6 min read By Adrian
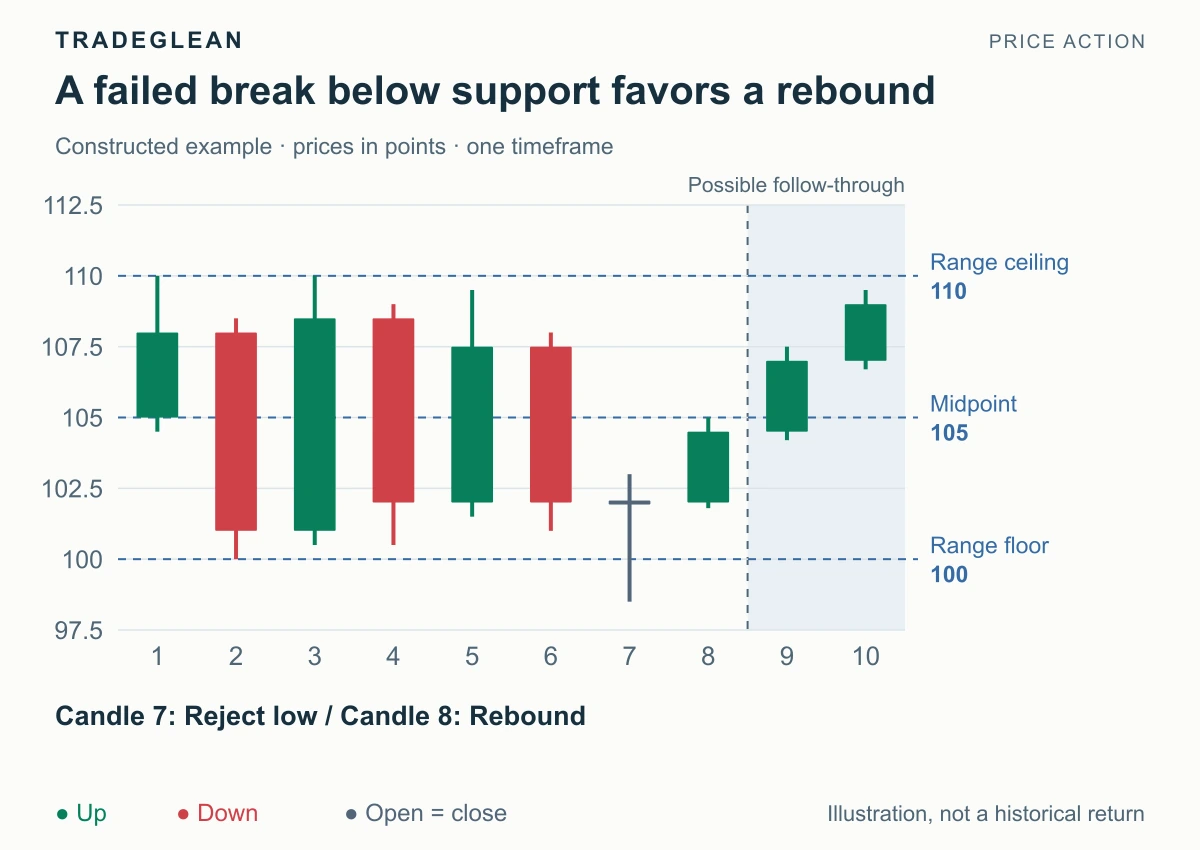
Read article Entry techniques Identify a trading range, distinguish its edges from the middle, and read bullish rejections at the floor or bearish rejections at the ceiling.
Beginner Sep 13, 2026 5 min read By Adrian
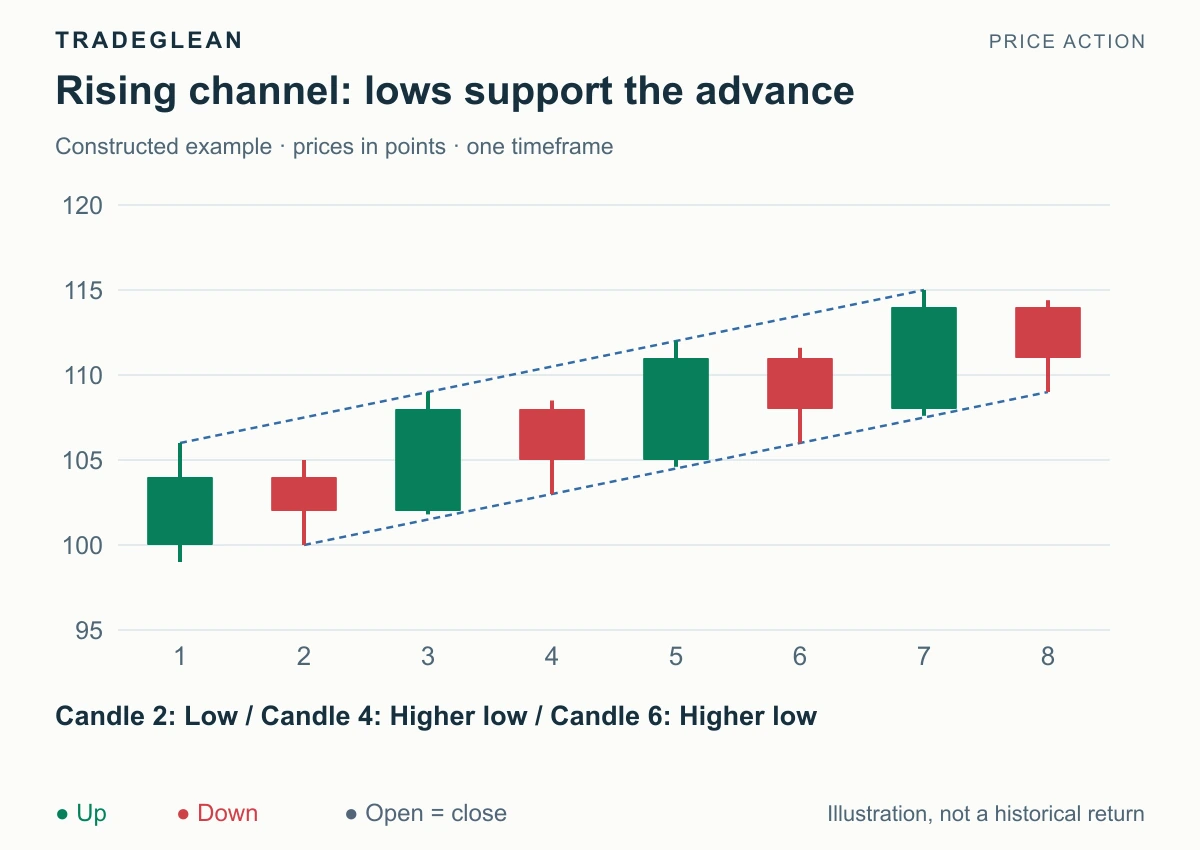
Read article Charts & candlesticks Identify rising and falling channels, distinguish trend lines from channel lines, and use shallow or deep pullbacks to judge the strength of a move.
Beginner Sep 13, 2026 5 min read By Adrian
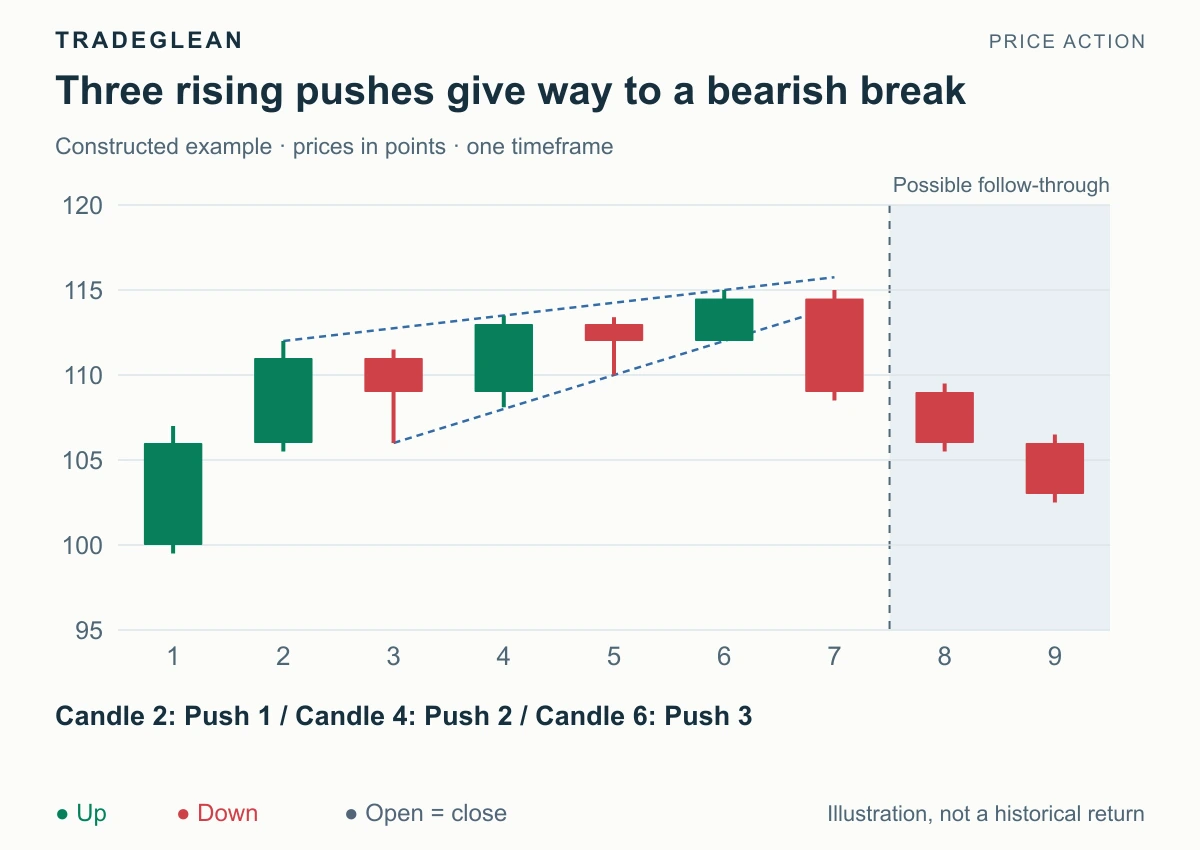
Read article Charts & candlesticks Identify rising and falling wedges, count three pushes with intervening pullbacks, and distinguish a confirmed reversal from a failed reversal attempt.
Intermediate Sep 13, 2026 4 min read By Adrian
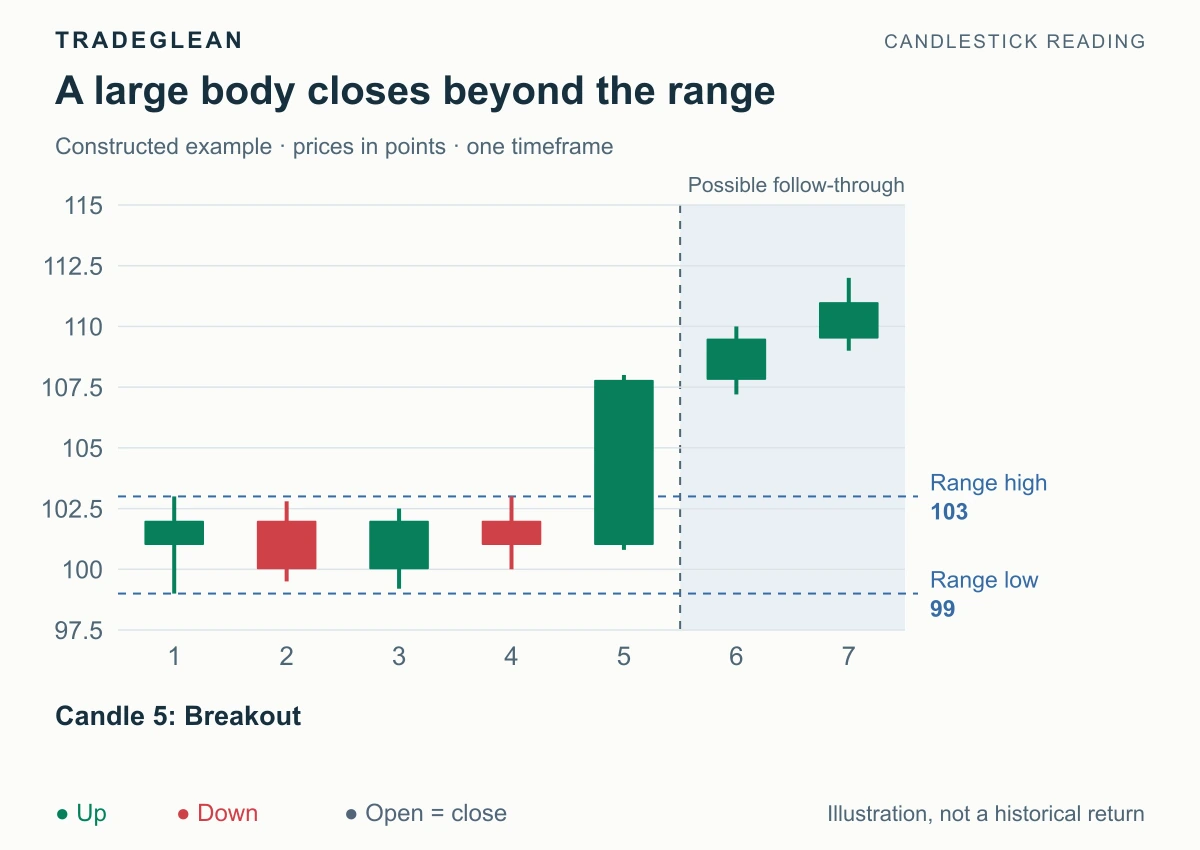
Read article Entry techniques Learn what a breakout candle is, compare bullish and bearish closing breaks, spot wick-only attempts, and separate confirmation from an entry fill.
Beginner Sep 12, 2026 7 min read By Adrian
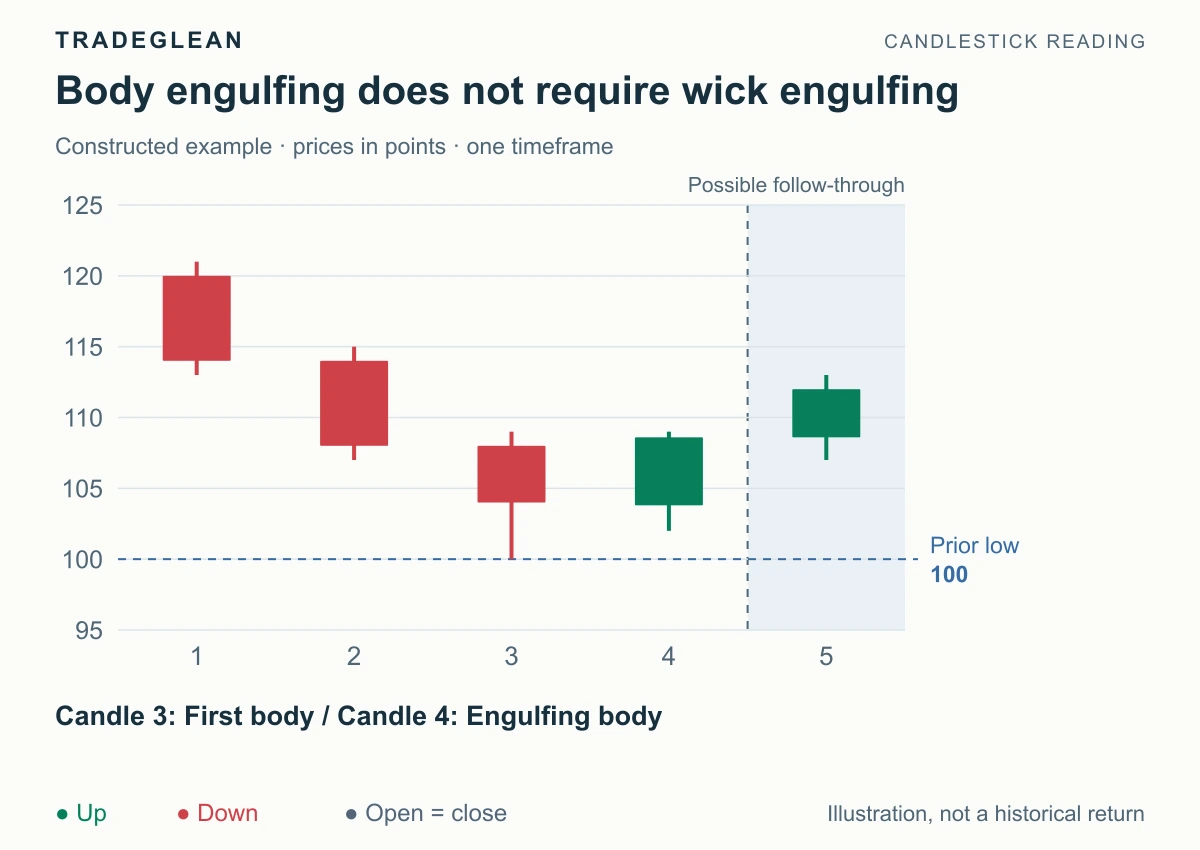
Read article Charts & candlesticks Identify bullish and bearish engulfing patterns by comparing two candle bodies, then use location, confirmation, and invalidation to read the next move.
Beginner Sep 12, 2026 6 min read By Adrian
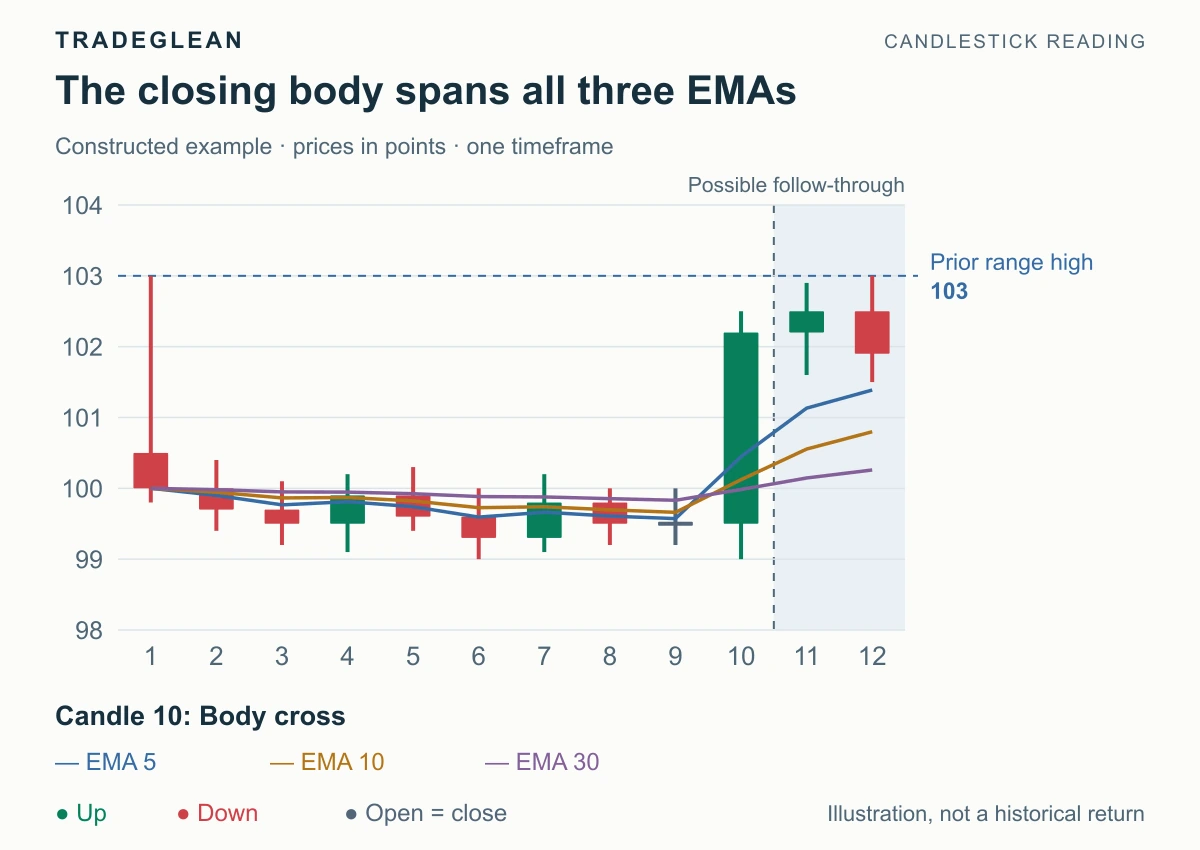
Read article Entry techniques Identify a green body crossing the 5-, 10-, and 30-period EMAs, then use a range break and retest to turn that bullish shift into a practical setup.
Intermediate Sep 12, 2026 6 min read By Adrian
Read article Charts & candlesticks Choose a bullish or bearish bias from the trend, signal location, and completed pattern, then define the trigger and the price that changes your view.
Beginner Sep 12, 2026 6 min read By Adrian
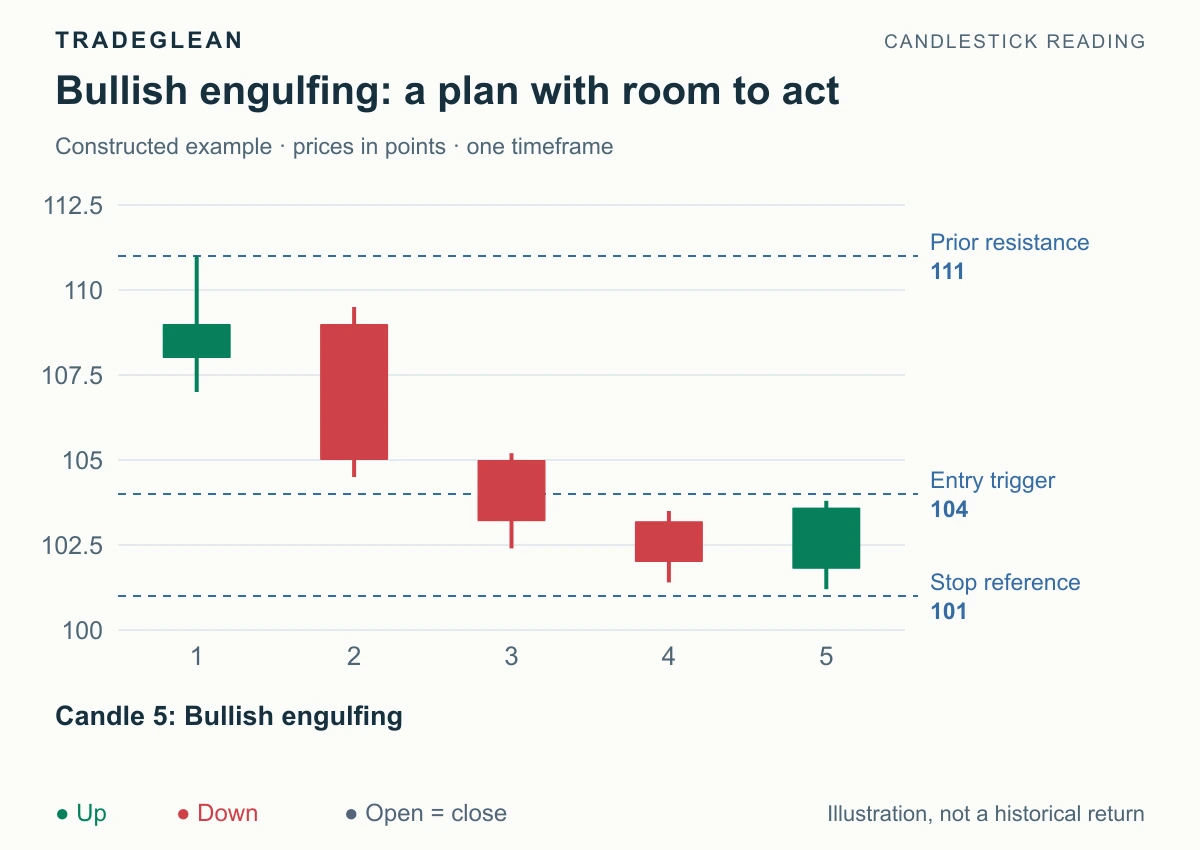
Read article Stops & exits Turn a directional candlestick signal into a complete trading plan: identify the pattern, define an entry, set the failure boundary, and calculate size.
Beginner Sep 12, 2026 6 min read By Adrian
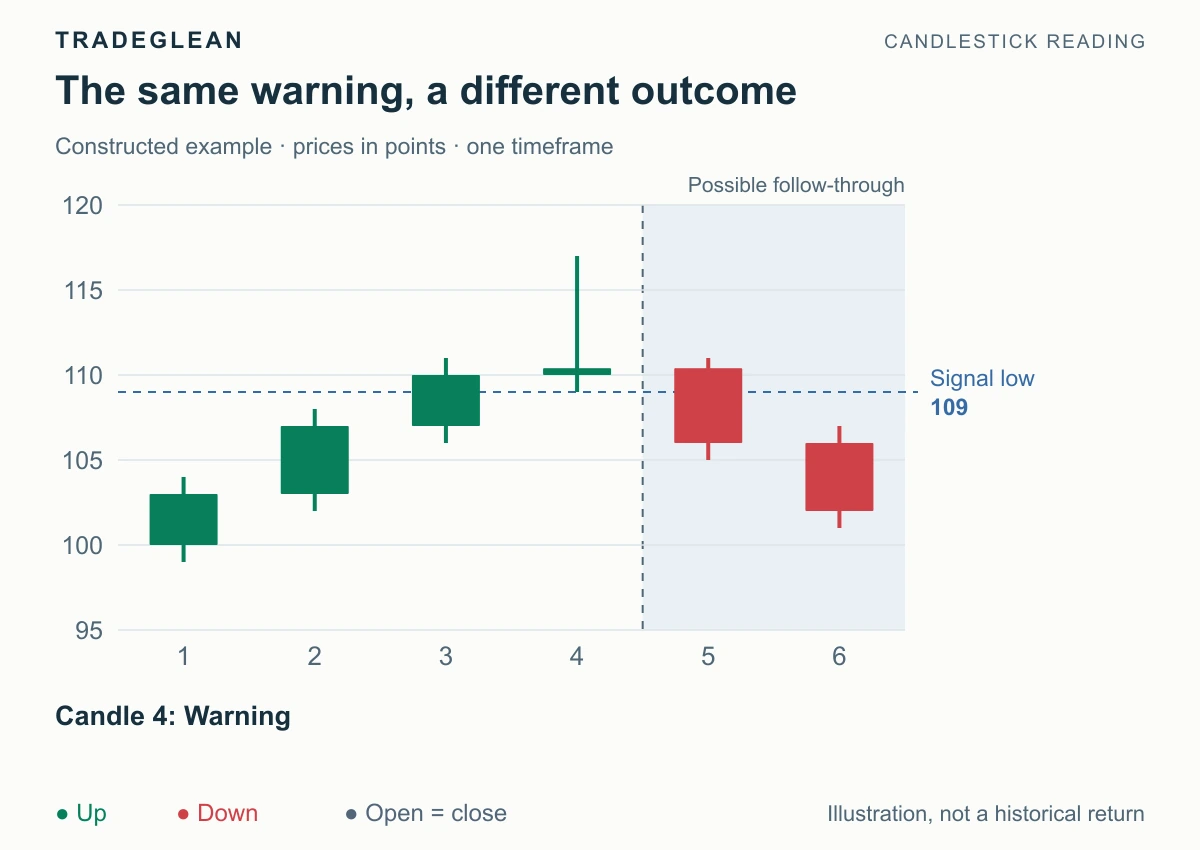
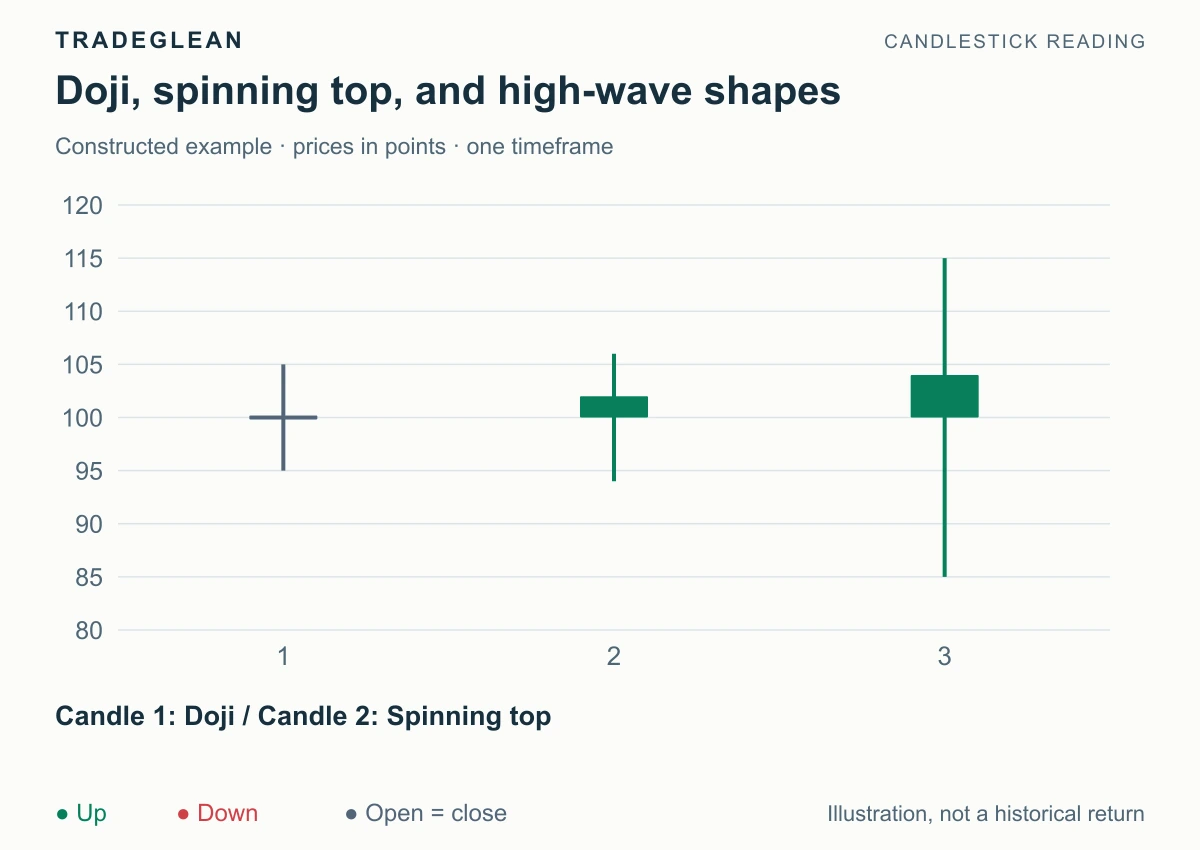
Read article Charts & candlesticks Use doji and spinning tops to read a pause within a trend, identify reversal warnings at key levels, and follow the break that establishes direction.
Beginner Sep 12, 2026 5 min read By Adrian
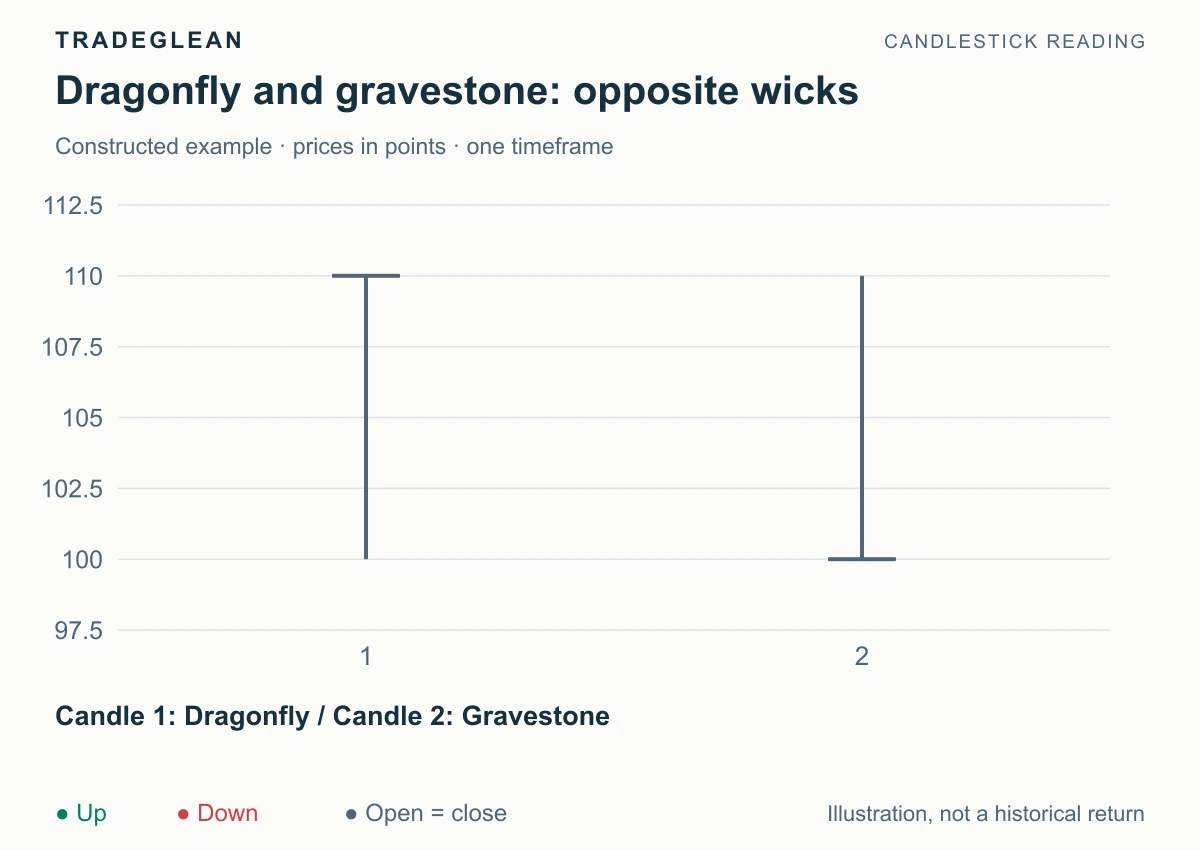
Read article Charts & candlesticks Recognize dragonfly and gravestone doji from their wicks and closing prices, then apply their bullish and bearish readings at support and resistance.
Beginner Sep 12, 2026 5 min read By Adrian
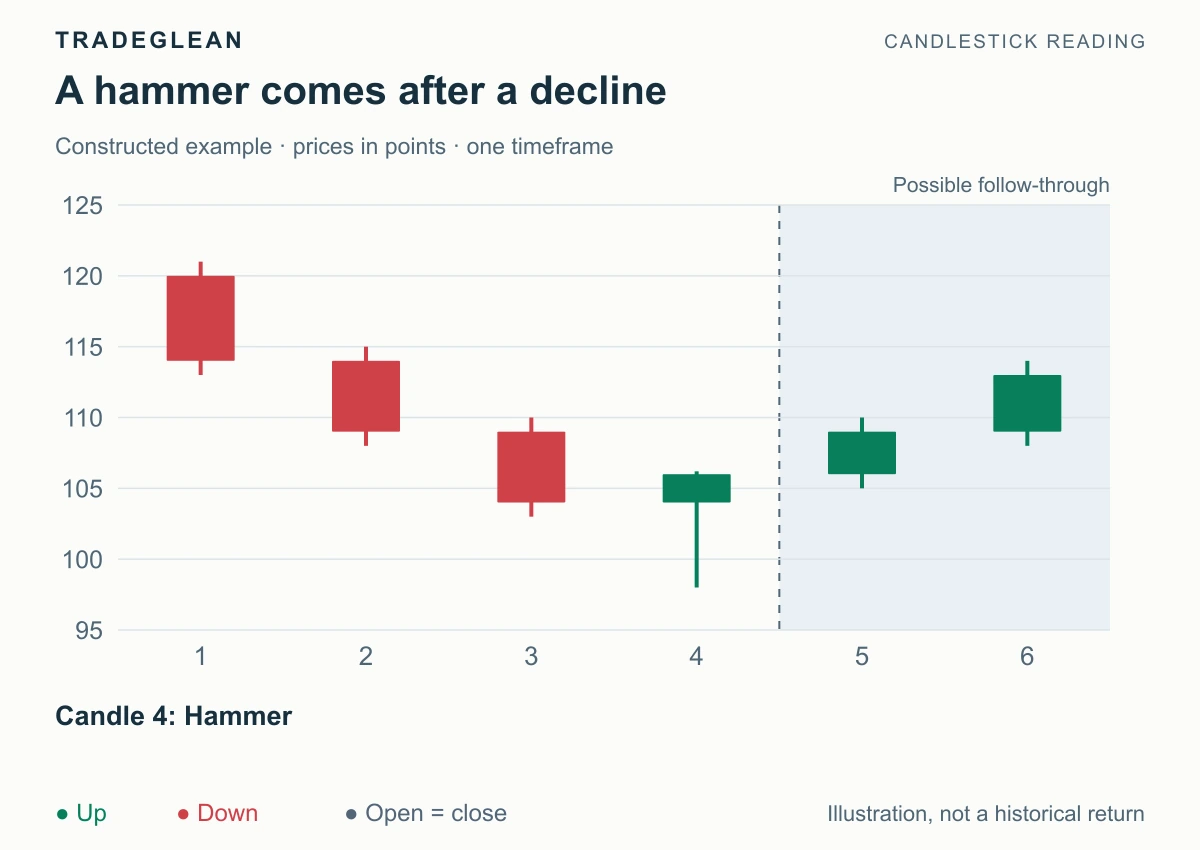
Read article Charts & candlesticks Recognize a hammer or hanging man from its body, lower wick, and trend position, then learn the bullish and bearish triggers for each setup.
Beginner Sep 12, 2026 5 min read By Adrian
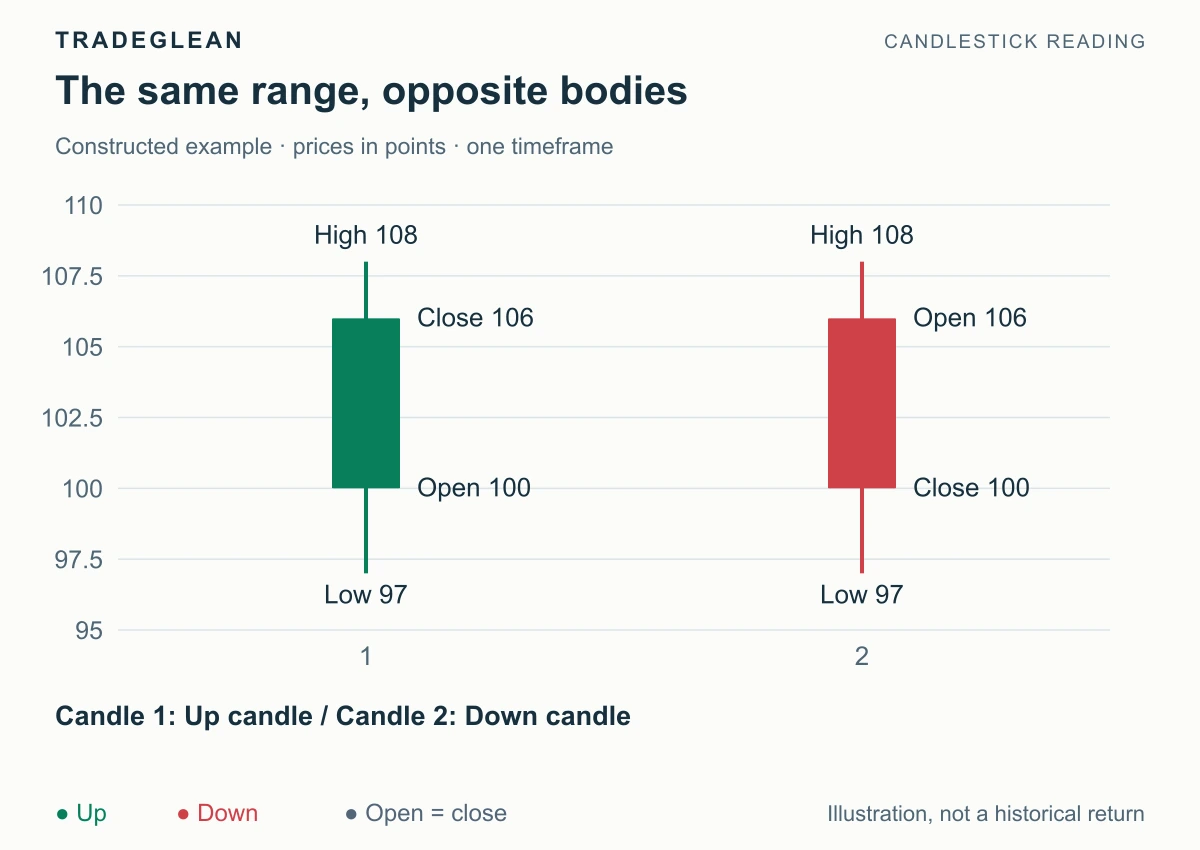
Read article Trading basics Understand the open, high, low, and close, calculate bodies and wicks, and distinguish what a candle shows from what it cannot tell you.
Beginner Sep 12, 2026 5 min read By Adrian
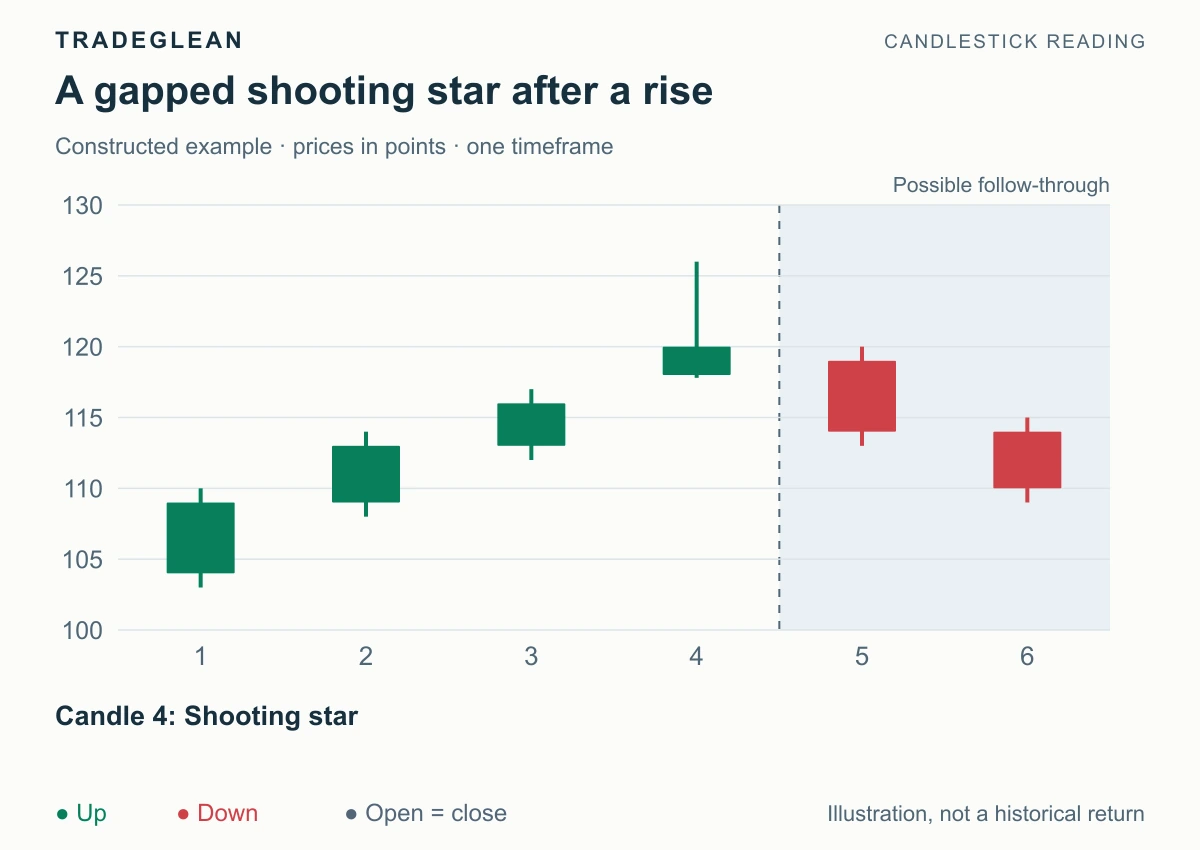
Read article Charts & candlesticks Identify long-upper-wick candles and distinguish a bearish shooting star at resistance from a bullish inverted-hammer setup after a decline.
Beginner Sep 12, 2026 5 min read By Adrian
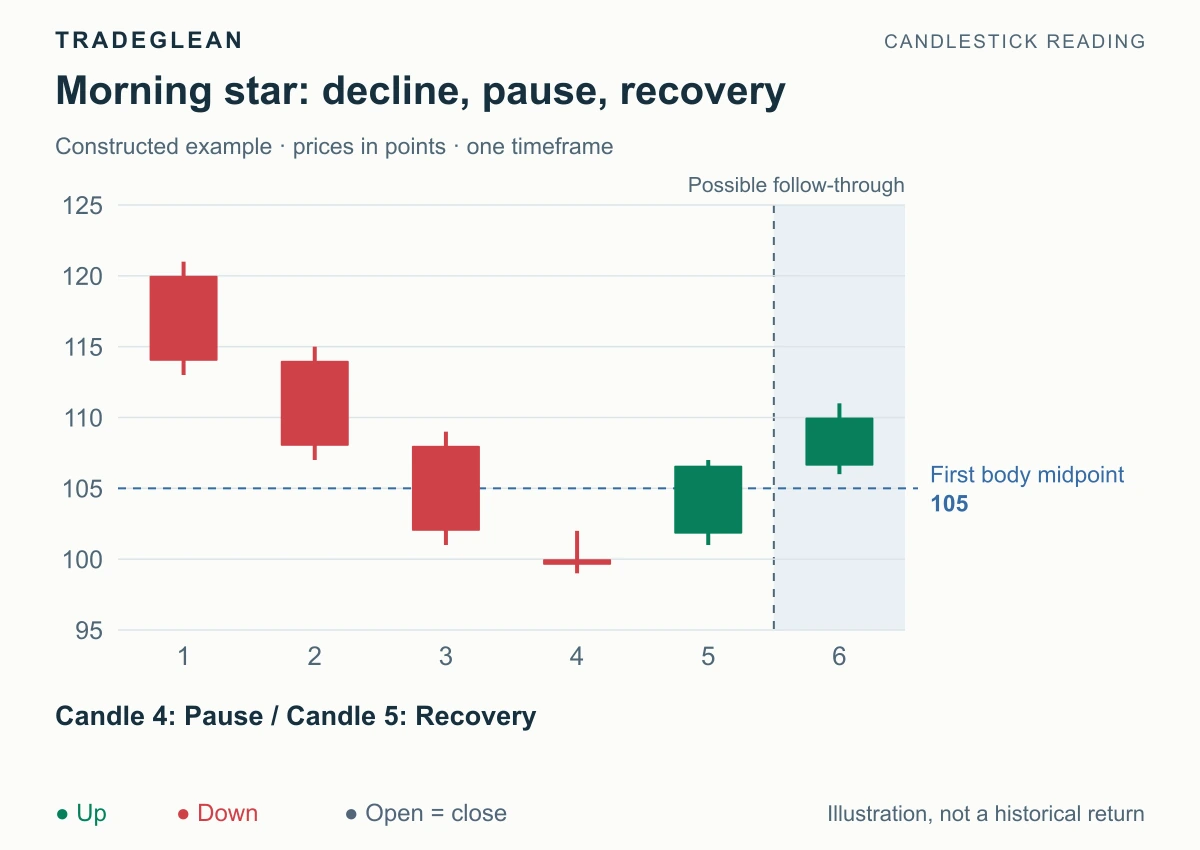
Read article Charts & candlesticks Recognize the three candles of a morning or evening star, check the final close, and apply the bullish or bearish reversal method.
Beginner Sep 12, 2026 5 min read By Adrian
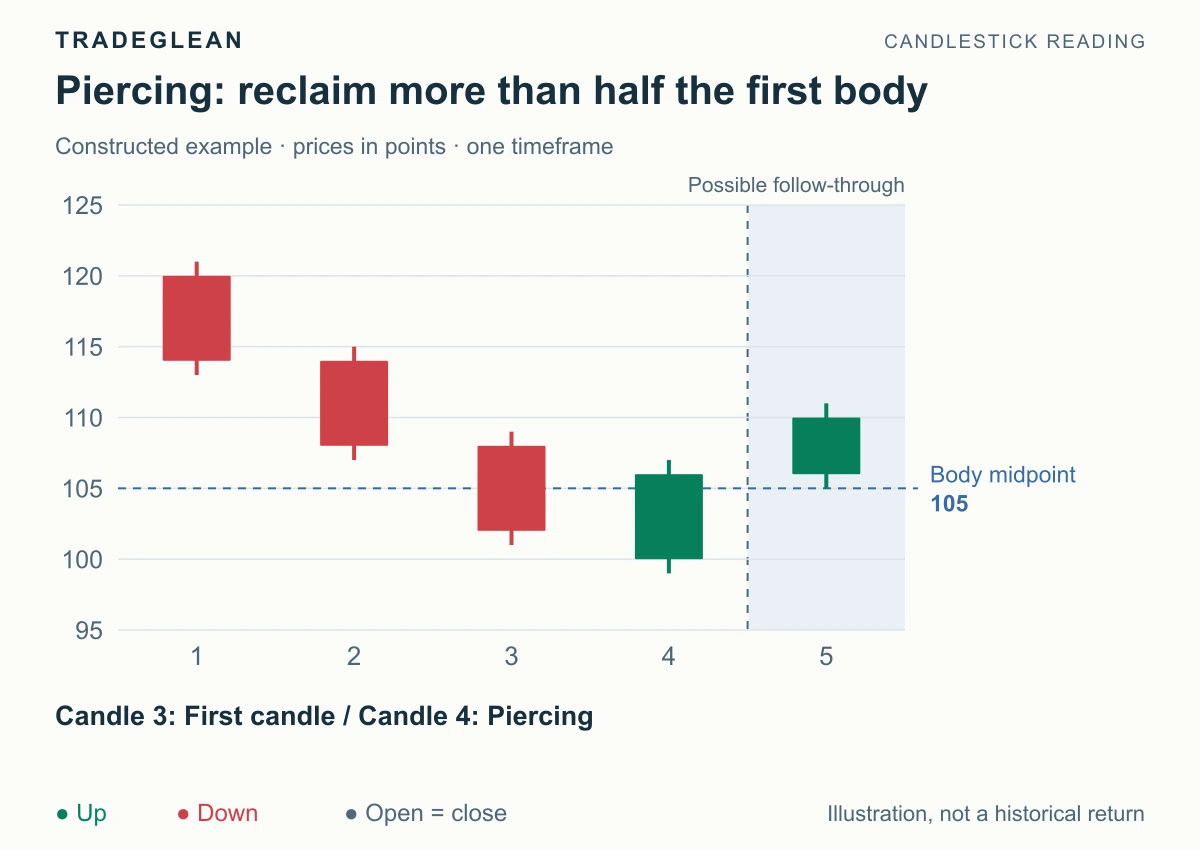
Read article Charts & candlesticks Recognize these two-candle reversal signals using the body midpoint, then apply a bullish piercing pattern or bearish dark cloud cover at the right level.
Intermediate Sep 12, 2026 6 min read By Adrian
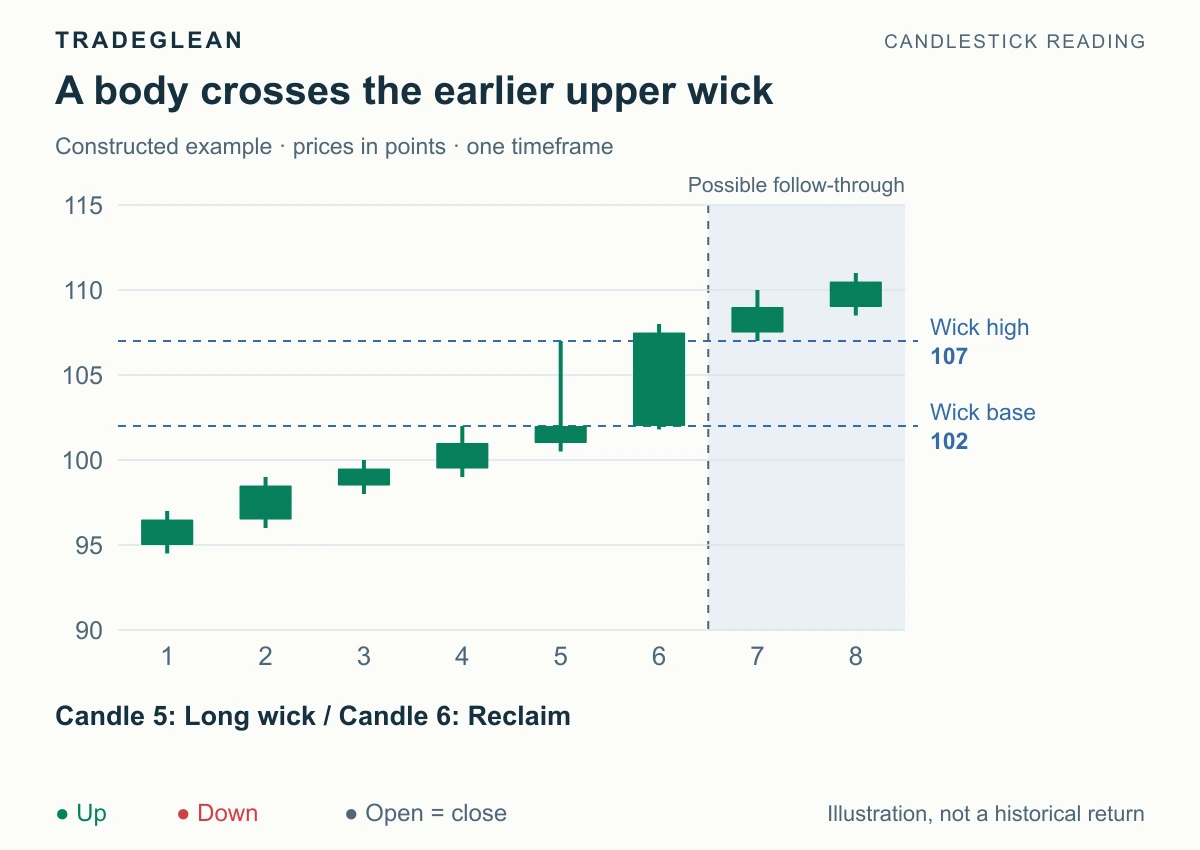
Read article Charts & candlesticks Identify a candle body reclaiming an earlier wick, distinguish a full reclaim from a brief touch, and use the completed pair to read trend continuation.
Intermediate Sep 12, 2026 6 min read By Adrian
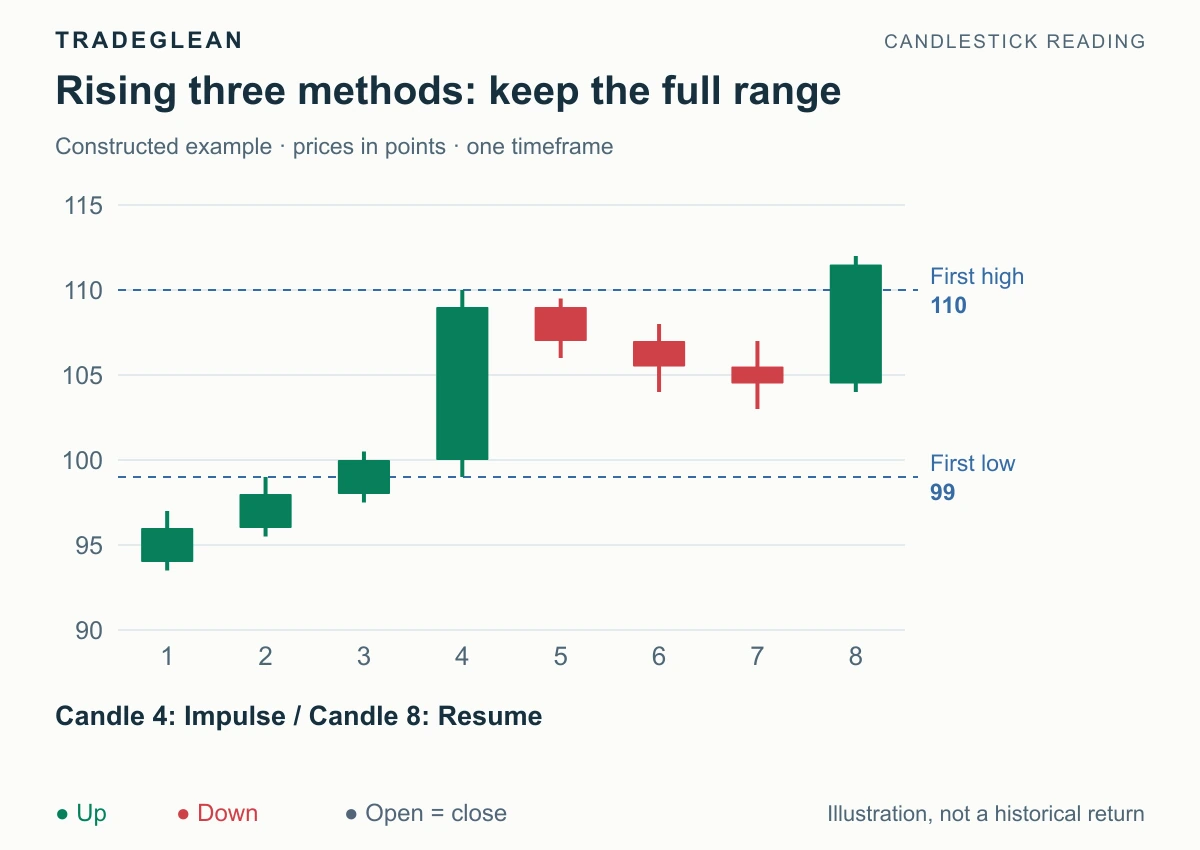
Read article Charts & candlesticks Identify the five candles of rising and falling three methods, check the pullback boundaries, and use the final close to read bullish or bearish continuation.
Intermediate Sep 12, 2026 5 min read By Adrian
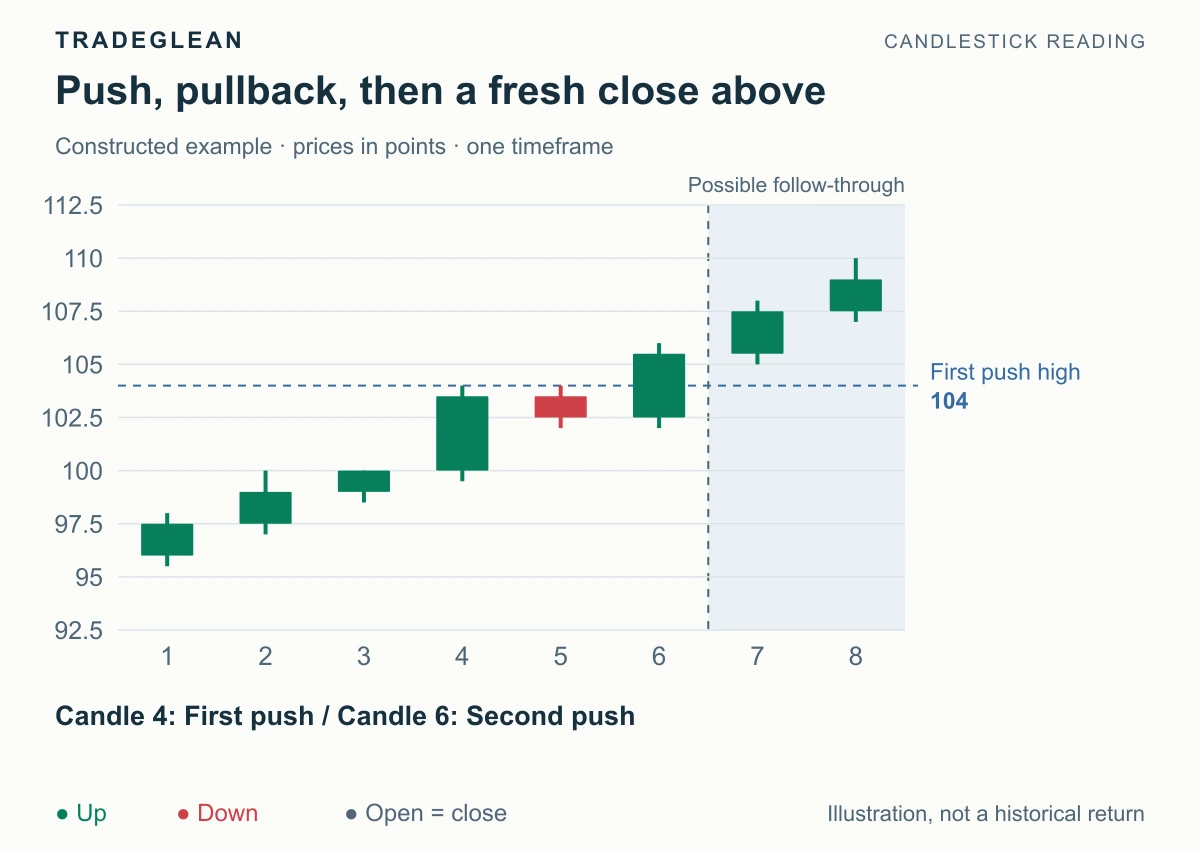
Read article Charts & candlesticks Recognize a push, contained pullback, and renewed push, then use green-red-green or red-green-red sequences to read bullish or bearish continuation.
Intermediate Sep 12, 2026 5 min read By Adrian
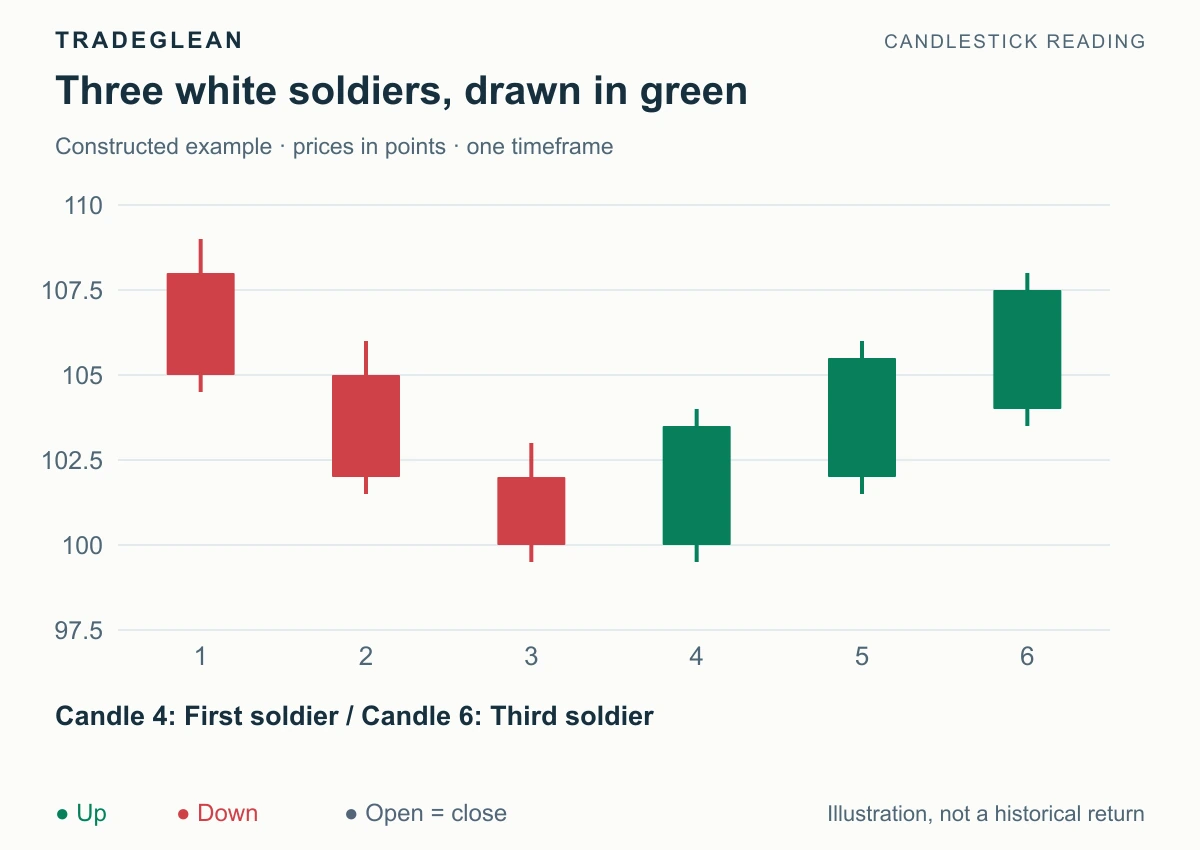
Read article Charts & candlesticks Identify three white soldiers and three black crows from their bodies, opens, and closes, then use the sequence to read bullish or bearish pressure.
Beginner Sep 12, 2026 5 min read By Adrian
Read article