Three White Soldiers and Black Crows: Read the Direction
Identify three white soldiers and three black crows from their bodies, opens, and closes, then use the sequence to read bullish or bearish pressure.
Candlestick Reading for Beginners
Browse the lessons
The foundations
Reading a single candle
Reversal combinations
Momentum, continuation & breakouts
- Wick Reclaims: Read Bullish and Bearish Continuation5 min read
- Three-Candle Continuation: Identify the Next Push5 min read
- Three White Soldiers and Black Crows: Read the Direction5 min read · You are here
- Rising and Falling Three Methods: Spot Trend Continuation5 min read
- Breakout Candles: Identify Bullish and Bearish Breaks5 min read
Three soldiers are bullish; three crows are bearish
Three white soldiers after a decline signal a bullish reversal setup. Three black crows after an advance signal a bearish reversal setup. The value comes from sustained progress across three candles: each new close extends the move rather than giving it back.
The traditional names use white and black. TradeGlean draws the soldiers green and the crows red, matching the convention that green closes above the open and red closes below it.
Similar directional runs can occur within an existing trend. Their pressure is still bullish or bearish, but the role is then continued momentum rather than a fresh reversal.
How to identify the three candles
Each formation uses three adjacent completed candles.
| Feature | Three white soldiers | Three black crows |
|---|---|---|
| Bodies | Three substantial green bodies | Three substantial red bodies |
| Closes | Successively higher | Successively lower |
| Finish | Near each candle's high | Near each candle's low |
| Second and third opens | Inside the previous body | Inside the previous body |
| Classic reversal context | After a decline | After an advance |
The first candle must be meaningful relative to nearby candles, and the second and third should continue that progress. Three tiny green bodies drifting sideways are not a clear soldiers formation. Long upper wicks on successive green candles weaken the strong-close picture; long lower wicks do the same for crows.
On continuous-price charts, opens can share the preceding closing edge. Label that an edge-open variation if your definition accepts it. The figures below use opens clearly inside the prior bodies.
See the bullish soldiers example
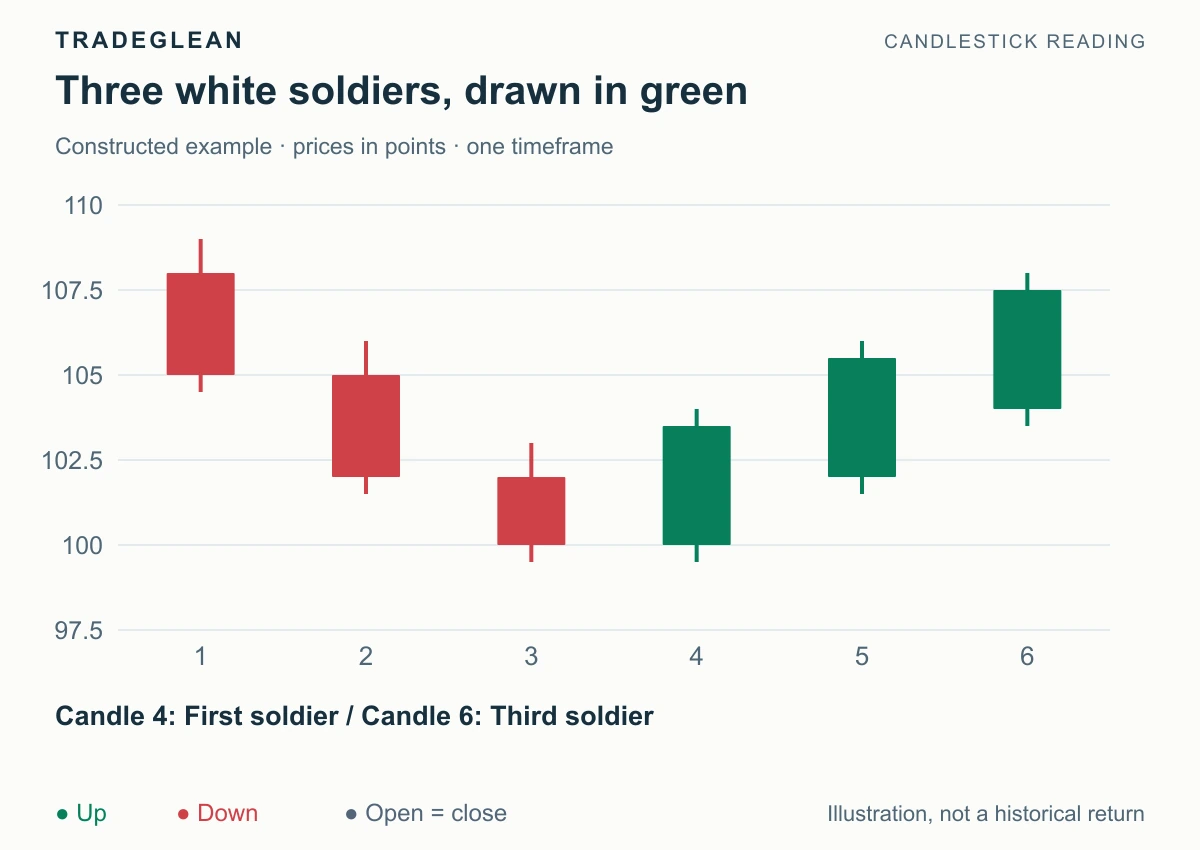
Constructed prices. The earlier decline establishes the local reversal context.
| Candle | Open | High | Low | Close |
|---|---|---|---|---|
| 4 | 100 | 104 | 99.5 | 103.5 |
| 5 | 102 | 106 | 101.5 | 105.5 |
| 6 | 104 | 108 | 103.5 | 107.5 |
Candle 5 opens at 102, inside candle 4's 100–103.5 body. Candle 6 opens at 104, inside candle 5's 102–105.5 body. The three closes rise from 103.5 to 105.5 to 107.5, each just half a point below its high.
The primary reading is bullish recovery. The later candles keep most of their gains and advance beyond the earlier closes. At the end of a decline into support, this is a reason to focus on upward follow-through and the formation of a higher low.
For an existing long position, a subsequent run of strong soldiers supports continued upward momentum. For a new entry after all three have completed, consider whether the move is already close to resistance. A clear direction does not require buying at the most extended price.
See the bearish crows example
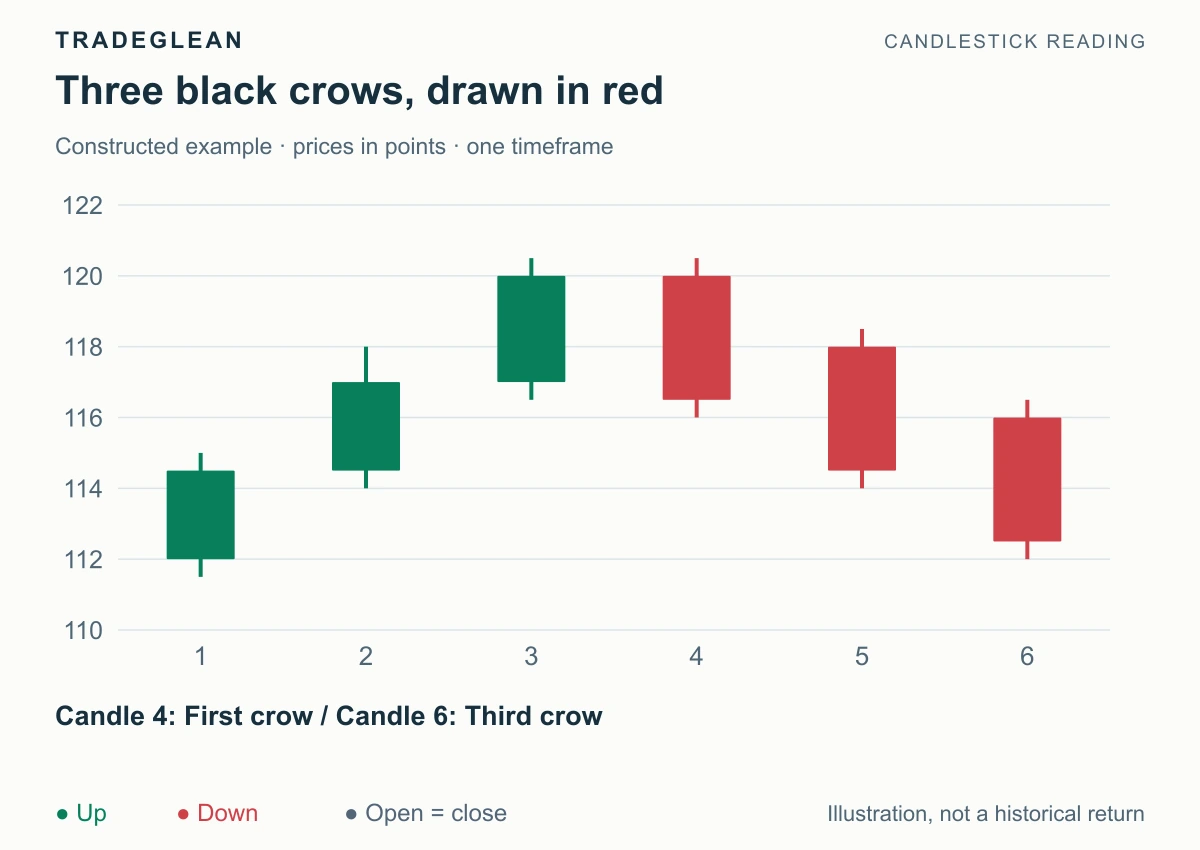
The red bodies open at 120, 118, and 116, then close at 116.5, 114.5, and 112.5.
The chart shifts from an advance to three sessions of downward progress. Each rebound at the open is followed by a lower finish. Favor a bearish move, with earlier swing lows acting as the next support references.
A rebound that stays below the recent breakdown area can form a separate bearish entry structure. Continued lower closes support the view. A strong recovery through the declining bodies warns that selling is losing control; use the selected structural high to define full invalidation.
A bearish reading can also inform protection of an existing long position. Opening a short is a separate decision that depends on the product and execution rules.
Near-miss: the middle candle barely advances
Replace the middle soldier with open 103.5, high 105, low 102.8, and close 103.6. Its body is 0.1, against a range of 2.2, or about 4.55%.
That is a pause rather than a substantial soldier. For this article's practice screen, flag a body at or below 10% of its range as too small for the clear example. The cutoff is a chosen recognition aid; passing it still requires a substantial body relative to neighboring candles.
A small middle candle may belong to a different continuation or star-shaped setup. Rejecting the soldiers label does not reverse the overall trend assessment.
Separate bullish pressure from an overcrowded entry
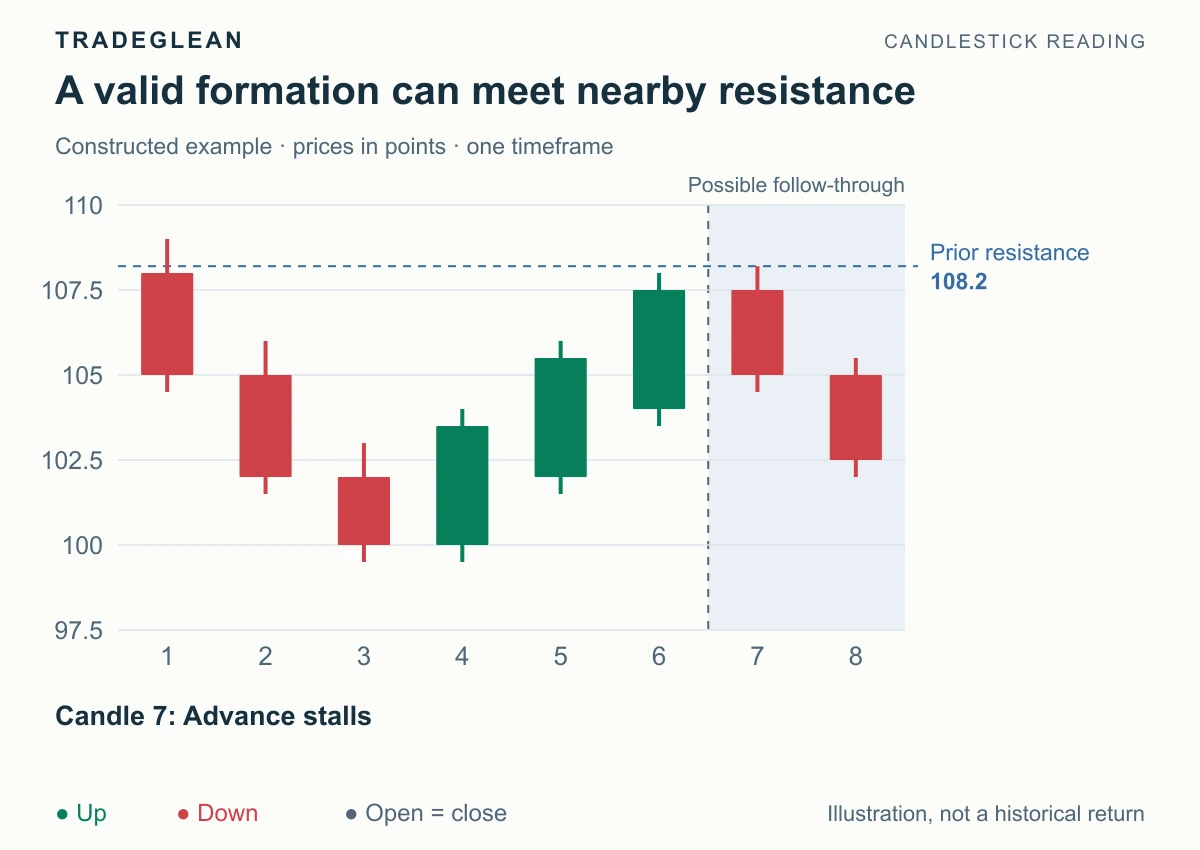
The resistance is already identified before the third soldier closes at 107.5.
The pattern remains bullish, but an entry at 107.6 is only 0.6 points below that obstacle. With a stop reference at 99.3, initial price risk is 8.3 points, leaving about 0.07R to resistance. The available entry offers very little room under that plan.
A useful decision is bullish view, wait for resistance to clear or for a new pullback structure. If price breaks the old high, evaluate whether it holds; if the advance gives way and breaks the chosen structural low, cancel the bullish setup. Do not silently move the target beyond nearby resistance just to improve the ratio.
The same logic applies to crows approaching support: bearish pressure can be clear even when a late short entry is poorly placed.
Recognition check
Three green candles close higher each time. The second opens above the previous high rather than within its body. Is it the exact soldiers formation shown here?
Answer: No. It is a rising sequence with a gap, not this strict inside-open example. Describe the bullish momentum accurately, then apply the definition of the particular pattern you are recording.
References
StockCharts' Pattern Dictionary and IG's candlestick guide describe soldiers and crows. Use the trading-plan guide for entry and risk calculations. All figures are constructed examples.