Head and Shoulders: Identify the Shape and Neckline Break
Identify head-and-shoulders tops and bottoms through their pivots and neckline, then distinguish the completed reversal from an unfinished outline.
Price Action: Trends, Pullbacks & Reversals
Browse the lessons
Bar relationships and channels
Pullbacks and trend development
- High 1, High 2, Low 1, Low 2: Count Pullback Attempts5 min read
- Simple Pullbacks: Find a Clear Trend Restart5 min read
- First Break vs. Second Break: Trade the Pullback Restart5 min read
- Complex Pullbacks and Two-Legged Corrections5 min read
- Spike-and-Channel and Stair-Step Trends: Read the Progress5 min read
Trading ranges and breakout structures
Reversals and chart patterns
- Major Trend Reversals: Read the Break, Test, and Turn4 min read
- Double Tops and Bottoms: Identify the Test and Neckline4 min read
- Head and Shoulders: Identify the Shape and Neckline Break4 min read · You are here
- Final Flags: Identify the Failed Last Push4 min read
- Wedges and Three Pushes: Identify the Reversal Setup4 min read
- Contracting and Expanding Triangles: Read the Boundaries4 min read
Measuring the next move
A head-and-shoulders top favors a bearish reversal once price breaks its neckline. An inverse head-and-shoulders pattern favors a bullish reversal once price breaks above its neckline.
The recognizable outline helps organize the swings. The useful change is that a trend makes one final extreme, fails to repeat it on the next attempt, and then loses the intervening support or resistance.
How to identify the five key pivots
For a top, mark three peaks and the two lows between them. For a bottom, mark three troughs and the two intervening highs.
| Part | Top | Inverse pattern |
|---|---|---|
| Left shoulder | First peak after an advance | First trough after a decline |
| Head | Higher middle peak | Lower middle trough |
| Right shoulder | Peak beneath the head | Trough above the head |
| Neckline | Line through the two intervening lows | Line through the two intervening highs |
| Completion used here | Close beneath the neckline | Close above the neckline |
The shoulders can differ in height or width, but the head must remain the clear central extreme. Three rising peaks are not a head-and-shoulders top. Two peaks without a central higher head belong to a different structure.
The neckline may slope. If it does, compare the breakout close with the line's value at that candle, not with a horizontal price borrowed from one old pivot.
Follow the bearish example
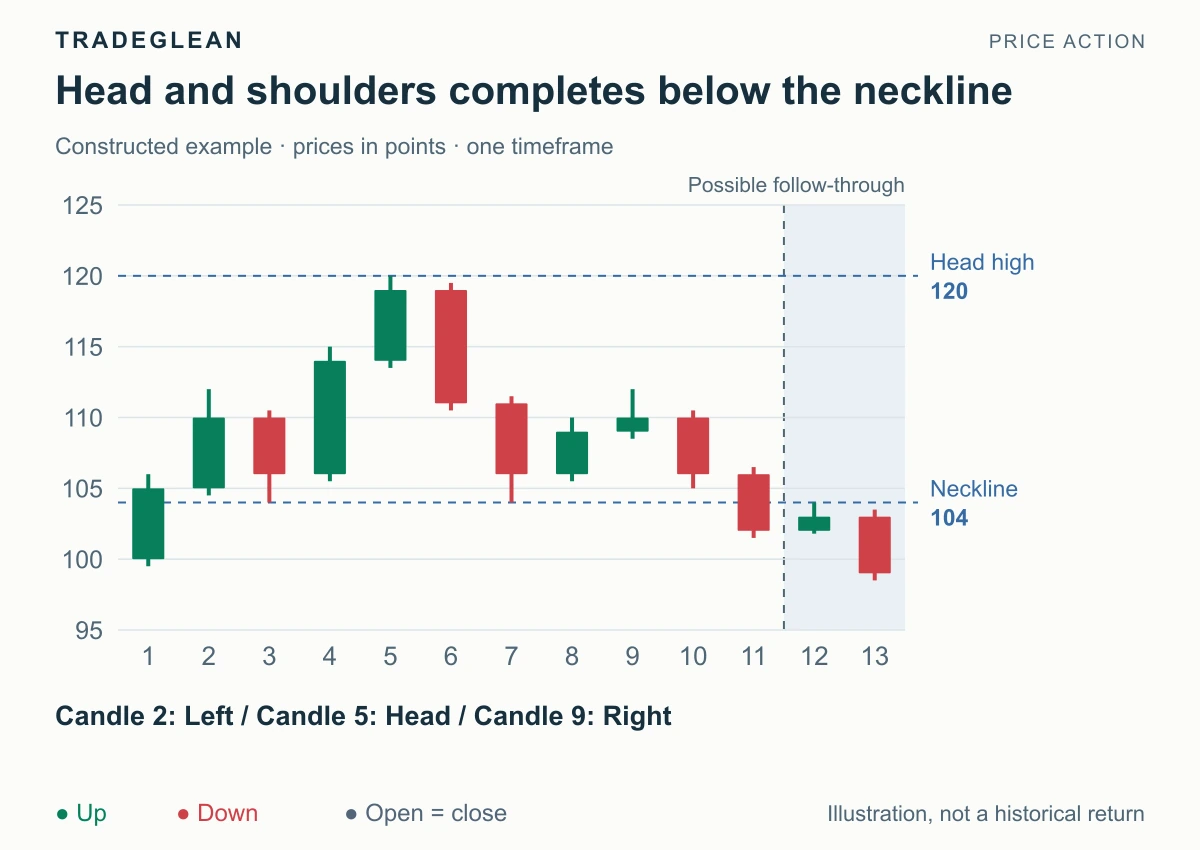
Constructed schematic with equal candle periods. It illustrates price relationships rather than a fixed formation duration.
The left shoulder reaches 112 on candle 2. The pullback on candle 3 reaches 104. The next advance sets the head at 120 on candle 5, before another retreat reaches 104 on candle 7.
Those two reaction lows define a horizontal neckline at 104. Candle 9 forms the right shoulder at 112, below the head. Buyers have recovered, but they have not repeated the advance to 120.
Candle 11 closes at 102, breaking the neckline. This is the bearish completion. Candle 12 retests 104 from below, and candle 13 closes at 99.
The right shoulder identifies the failed recovery; the neckline break shows sellers extending beyond the lows that had previously held.
Apply the inverse pattern
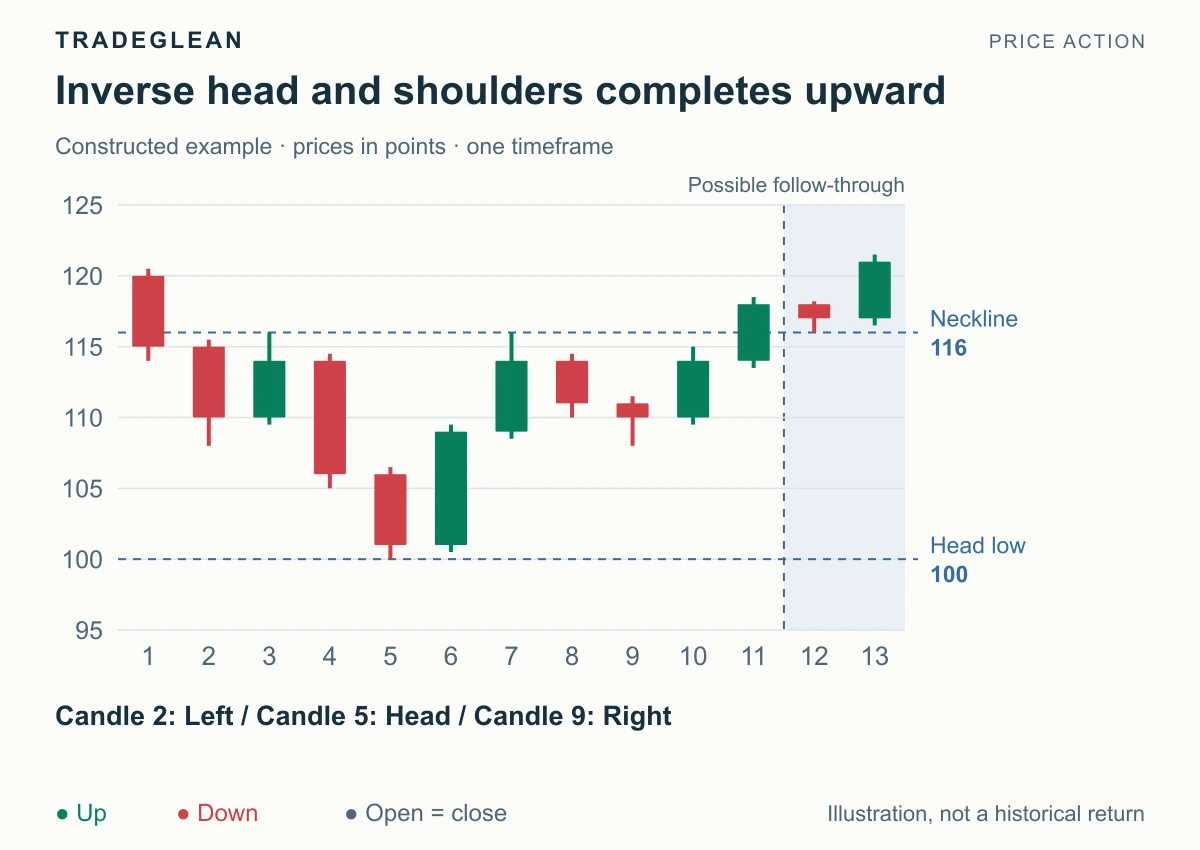
Here the shoulder lows are 108 and the head reaches 100. The intervening rebound highs both reach 116, defining the neckline.
Candle 11 closes at 118, above 116. Candle 12 then tests 116 from above, and candle 13 closes at 121. The sequence supports the bullish reversal: a lower central low, a higher right-side test, and a break above the recovery highs.
A touch of the neckline would not meet the close-based trigger. Likewise, a promising right shoulder that never produces an upward break remains an unfinished candidate.
Recognize a rounded turn without inventing shoulders
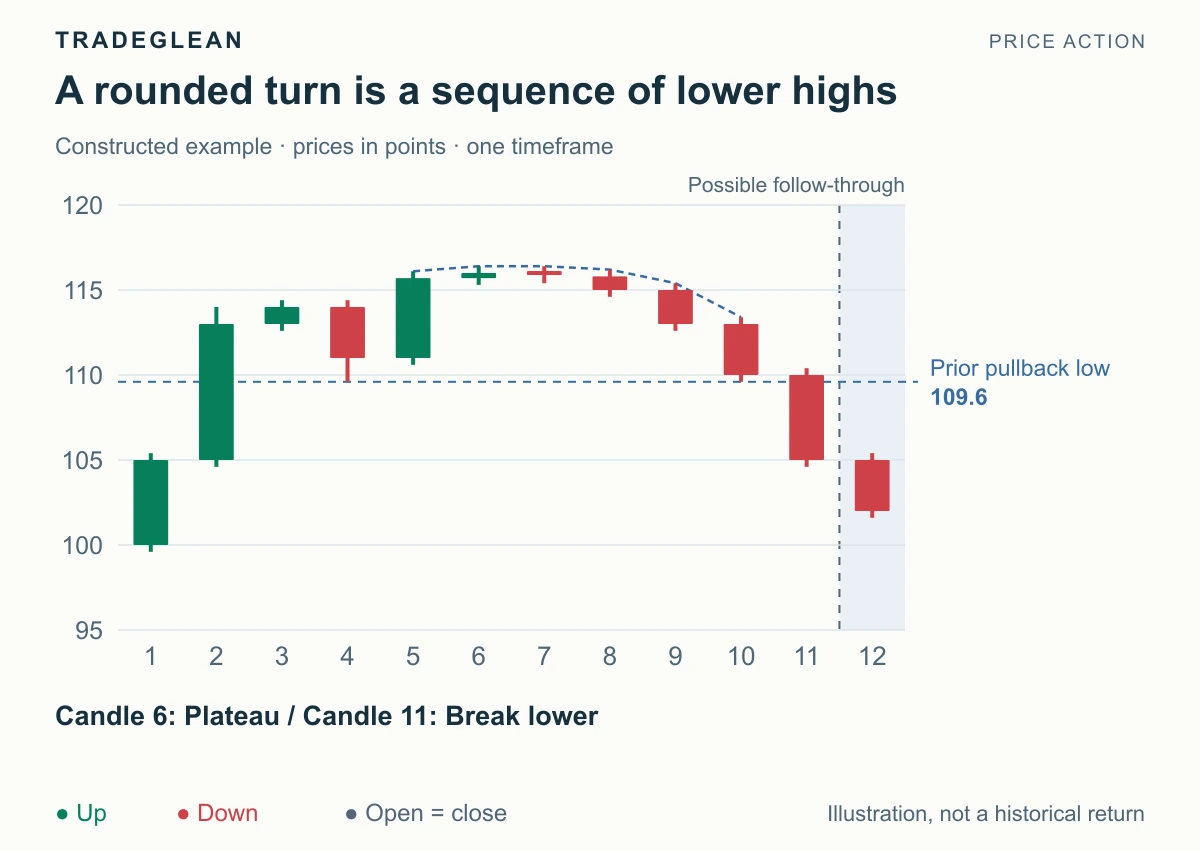
A rounded turn spreads the change across a broad cluster. It need not provide three distinct peaks that can be labeled as shoulders and a head.
In this example, candle 4 establishes a pullback low at 109.6. Price recovers into a flatter region around 116, with highs of 116.4 on candles 6–7. The later highs then decline through 116.2, 115.4, and 113.4.
Candle 11 closes at 105, below the earlier 109.6 pullback low. The bearish evidence is the loss of upward progress followed by lower highs and a break of visible support. A smooth curve drawn over the top is only a visual aid.
This example does not need a fictional neckline. Use the actual swing level that the chart supplies.
Keep the failure level attached to the setup
For the illustrated head-and-shoulders top, recovery above the right shoulder at 112 would undermine the lower-high entry premise. Recovery above the head at 120 would contradict the entire top.
For the inverse pattern, a fall below the right shoulder at 108 challenges that local bullish setup. A fall below the head at 100 contradicts the broader bottom.
A neckline retest and a full structural failure are different events. Decide which premise you are evaluating, then use its corresponding level. The major trend reversal guide explains the broader break-and-test sequence.
Further reading
For classical identification and the role of volume, see StockCharts' Head and Shoulders Top and Head and Shoulders Bottom. Target calculations are covered separately in Measured-Move Targets.