First Break vs. Second Break: Trade the Pullback Restart
Distinguish FB and SB pullback setups, identify first and second trend-recovery attempts, and compare their confirmation, location, and failure boundaries.
Price Action: Trends, Pullbacks & Reversals
Browse the lessons
Bar relationships and channels
Pullbacks and trend development
- High 1, High 2, Low 1, Low 2: Count Pullback Attempts5 min read
- Simple Pullbacks: Find a Clear Trend Restart5 min read
- First Break vs. Second Break: Trade the Pullback Restart5 min read · You are here
- Complex Pullbacks and Two-Legged Corrections5 min read
- Spike-and-Channel and Stair-Step Trends: Read the Progress5 min read
Trading ranges and breakout structures
Reversals and chart patterns
- Major Trend Reversals: Read the Break, Test, and Turn4 min read
- Double Tops and Bottoms: Identify the Test and Neckline4 min read
- Head and Shoulders: Identify the Shape and Neckline Break4 min read
- Final Flags: Identify the Failed Last Push4 min read
- Wedges and Three Pushes: Identify the Reversal Setup4 min read
- Contracting and Expanding Triangles: Read the Boundaries4 min read
Measuring the next move
Match the attempt to the strength of the pullback
A strong upward impulse followed by its first orderly pullback favors a bullish first-break setup. If the first recovery stalls and support survives another test, a second-break setup offers a later bullish attempt. In a downtrend, use the bearish mirror.
FB means First Break and SB means Second Break. Here, the break usually concerns a signal candle or compact pullback structure. It does not require price to have already exceeded the high or low of the entire preceding trend leg.
The names come from Bob Volman's price-action terminology. This article concentrates on their structural logic. Exact execution settings from one market should not be assumed to apply unchanged to every instrument or timeframe.
How to identify a first break
Look for a clear impulse, its first readable correction, and an attempt to move back in the impulse direction.
| Element | Bullish FB | Bearish FB |
|---|---|---|
| Initial movement | Strong upward impulse | Strong downward impulse |
| Pullback | First orderly downward or sideways correction | First orderly rebound or sideways correction |
| Signal reference | High of a completed recovery signal or compact pause | Low of a completed rejection signal or compact pause |
| Trigger | Price exceeds that high | Price breaks that low |
| Structural failure | Loss of the pullback support used by the plan | Recovery through the rebound resistance used by the plan |
The term “first” belongs to that particular impulse and correction. A market can produce a fresh impulse after a larger consolidation; it does not have to be at the start of a whole day's trend.
Follow a bullish FB with specific prices
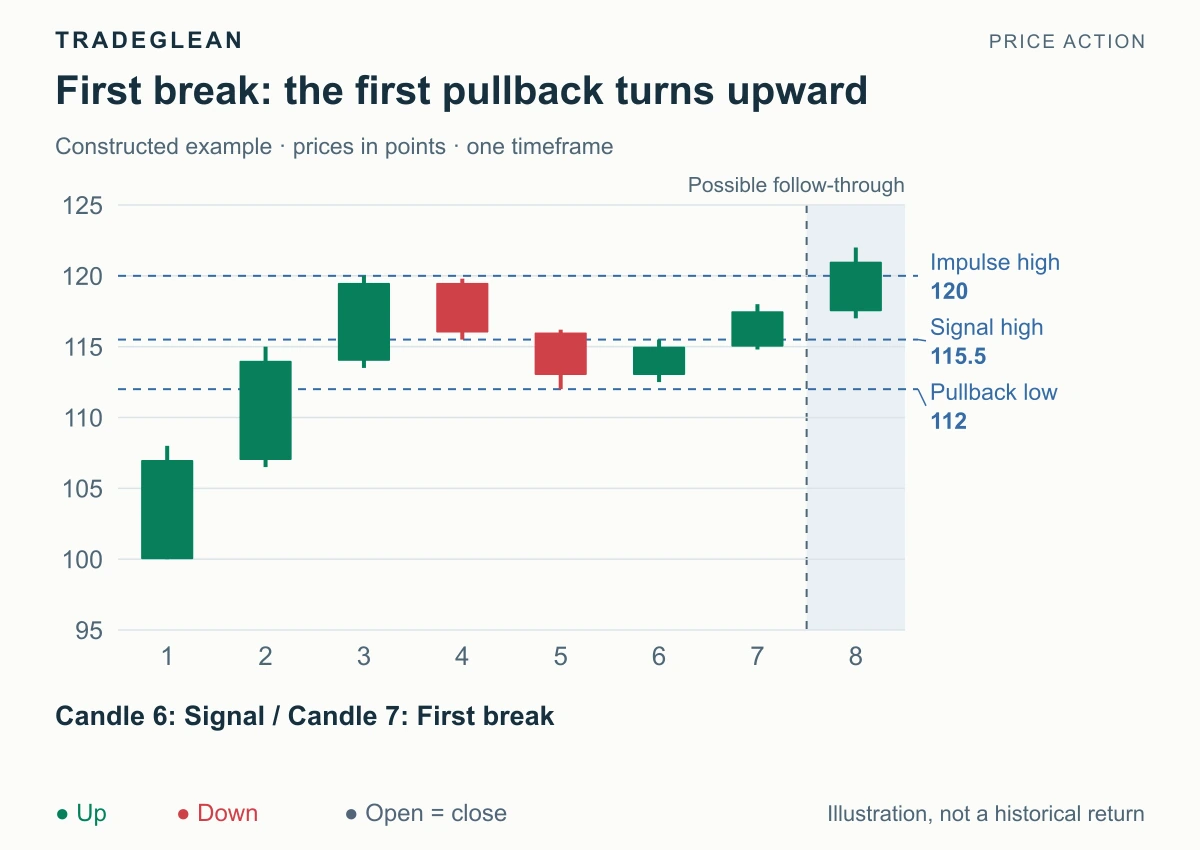
Constructed prices; green up and red down. The impulse reaches 120, and the first correction bottoms at 112.
The impulse runs from 100 to 120, a 20-point movement. The pullback reaches 112, returning 8 points, or 40% of that impulse. This calculation measures the correction relative to the preceding move; it is not the percentage change in the instrument's price.
Candle 6 recovers from the low area and has a high of 115.5. Candle 7 exceeds that high and closes at 117.5. The first-break trigger has occurred even though price has not yet cleared the old impulse high at 120.
The working view is renewed upward movement toward that old high. The pullback low at 112 is a structural reference for a plan that requires the first correction to hold. Candle 8 subsequently reaches 122 and closes at 121, extending beyond the earlier extreme.
A half-retracement can be a useful comparison point, but neither 50% nor 61.8% is a universal boundary that guarantees an FB remains valid. A correction approaching the impulse origin has surrendered much more of the original move. Assess its structure instead of letting a Fibonacci label make the decision.
How to identify a second break
An SB needs another adjustment between the two recovery attempts. The bullish sequence is:
- An existing uptrend pulls back into a relevant area, often near the EMA20.
- A first upward attempt occurs and fails to sustain the recovery.
- Price tests the pullback area again without establishing a sustained opposite move.
- A second upward trigger appears within that same correction.
The H1 and H2 guide explains the adjacent-high counting rule. SB adds the trend, location, and repeated-test context to that count. Every higher-high event is not automatically a complete SB setup.
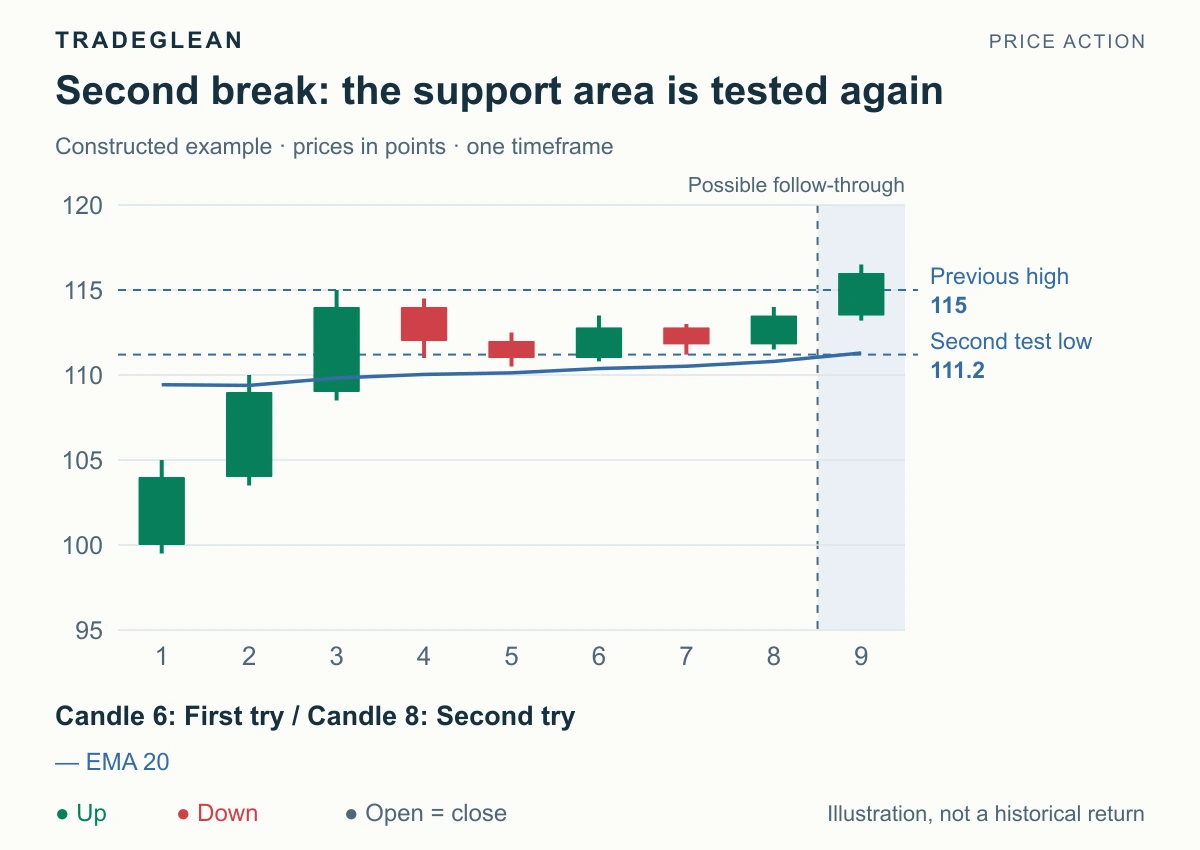
Candles 6 and 8 are the two attempts. The EMA20 is calculated using 240 earlier closes at 110, then the displayed closes.
Candle 6 reaches 113.5 after exceeding the previous 112.5 high. Candle 7 then pulls back to 111.2, holding above the first test low of 110.5. Candle 8 exceeds candle 7's 113 high and closes at 113.5. That is the second recovery attempt; the EMA20 is approximately 110.80 at that point.
The second test gives more information about the pullback area. It also delays the decision. The second trigger still has to leave sufficient room toward the prior 115 high relative to the chosen protection below the 111.2 second-test low. A recognizable setup can have a less attractive entry after price has already travelled far from its trigger.
Apply the bearish version
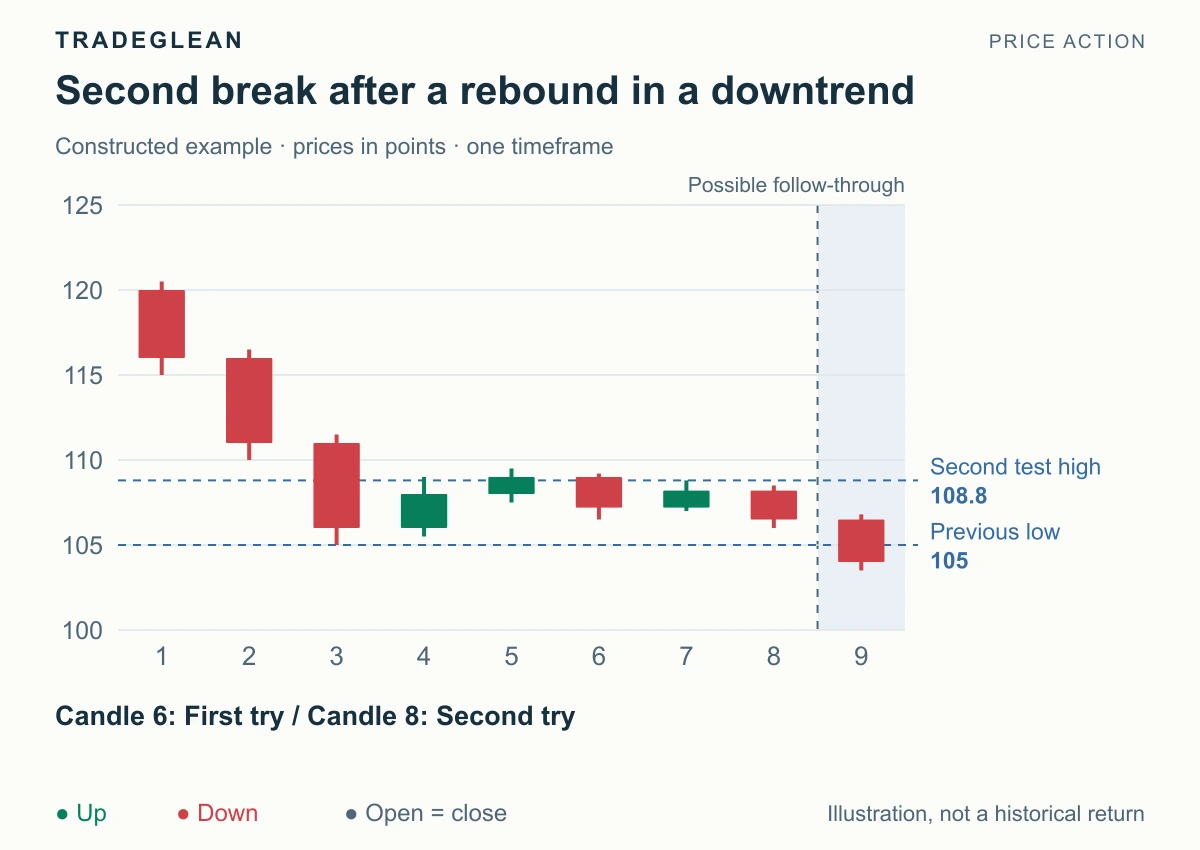
In the bearish mirror, candle 6 first breaks down to 106.5. Candle 7 rebounds, with a high of 108.8 and a low of 107. Its high remains below the first rebound high of 109.5. Candle 8 then breaks below 107 and closes at 106.5. The primary reading is renewed selling after the rebound's second test.
A recovery above the rebound high would undermine that bearish structure. The earlier declining extreme is the first reference ahead; a more distant measured target belongs to a later decision if the decline continues.
Separate second attempts from false breaks
The second bullish test can form a higher low, a similar low, or a brief lower low that is reclaimed. It does not have to take out the first low. A second attempt and a 2B-style false break therefore overlap in some examples but are not identical definitions.
Likewise, SB does not mean “try again after two stop-outs.” You may observe the first attempt without trading it. A new position needs a fresh valid trigger and its own risk check, regardless of what happened in your account.
If a large, independent range develops between the attempts, stop carrying the old FB/SB label across it. Mark the new boundaries. The shared pullback context is what makes the two attempts part of one setup.
Sources and next step
FB and SB terminology is associated with Bob Volman's Forex Price Action Scalping. Brooks' glossary defines the H/L counts used to describe the triggers here. Continue with complex pullbacks and two-legged corrections when the correction develops a larger swing structure.