Multiple Timeframes: Separate Market Direction from Entry Timing
Give the larger and smaller charts different jobs, use completed candles, and avoid changing timeframes to rescue a failed setup.
Give each chart one job
Multiple-timeframe analysis means reading the same instrument over different candle intervals. A larger chart can define the surrounding trend and important levels; a smaller chart can show the local setup and entry trigger.
The smaller chart is not an independent vote confirming the larger one. Both summarize overlapping price data. The benefit is seeing different levels of detail, not multiplying the amount of independent evidence.
Warrior Trading's multiple-timeframe article is a useful topic reference. The method below uses its own illustrative sequence and does not prescribe a universal chart combination.
Start with two roles, not many screens
| Chart role | Information to establish | Information it cannot supply alone |
|---|---|---|
| Context chart | Trend or range; nearby support and resistance | The exact execution price |
| Entry chart | Local pullback, signal, trigger, and failure level | Proof that the larger trend has reversed |
An hourly context chart and a five-minute entry chart are one possible pairing. They are examples, not settings every beginner should use. The holding period, instrument, liquidity, costs, and method determine whether a combination is useful.
CME's chart-types guide explains how candles summarize a selected interval. Twelve adjacent five-minute candles can form one hourly candle when their session boundaries align; that hourly candle's close is the last close, not the average of the twelve closes.
An hourly uptrend can contain a short decline
Consider constructed prices for a linear instrument. The hourly chart has advanced from 100 to 120 and is pulling back toward a previously marked 110–112 support zone. On the five-minute chart, that same pullback appears as a sequence of lower highs and lower lows.
Both observations can be correct. The larger uptrend gives context, while the smaller chart still shows selling. Entering just because hourly support is nearby would omit the local trigger.
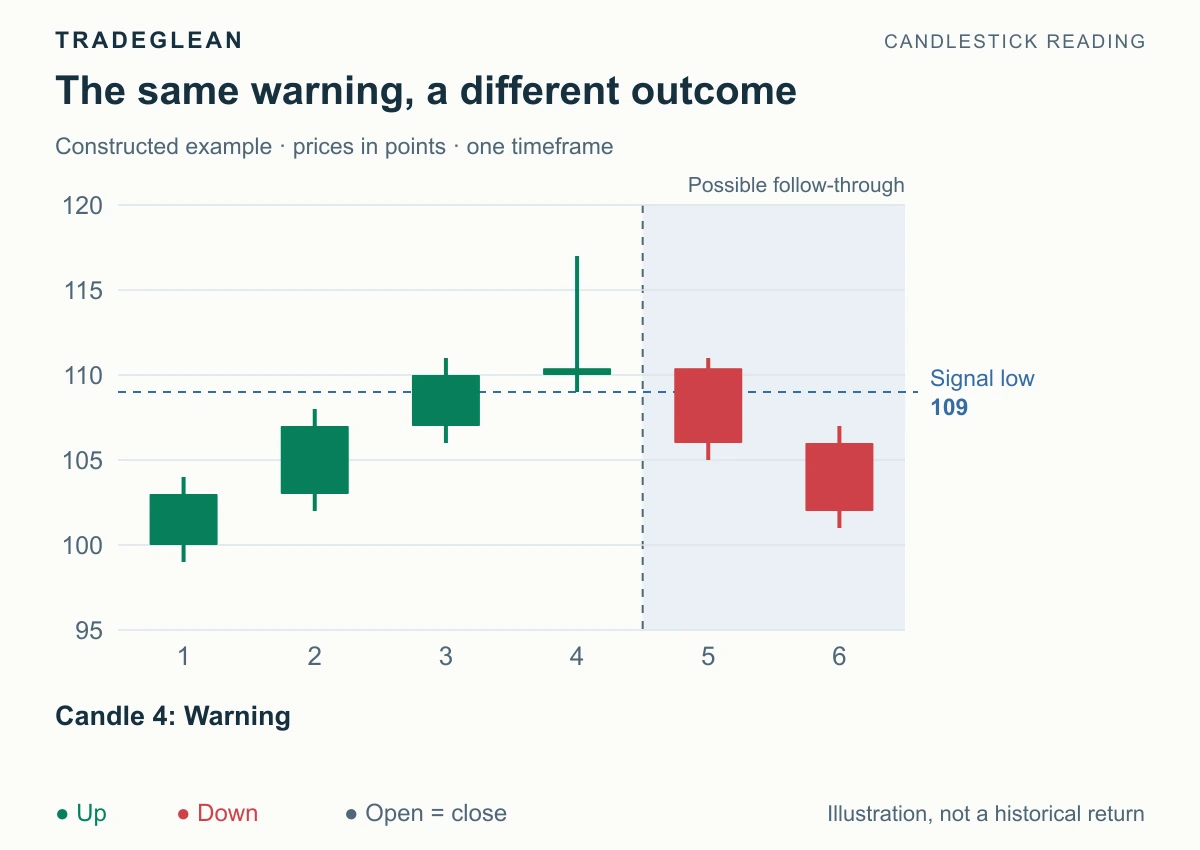
Suppose the smaller chart stops making new lows at 111, forms a compact pause with a high of 113, and then closes at 114. Under this example's rule, the close above 113 supplies the upward trigger. The earlier hourly high at 120 is an obstacle, not a guaranteed target. Losing the local low of 111 contradicts the specific pause-holding entry.
The support-zone guide explains how those boundaries must be identified before the reaction, rather than fitted to the outcome.
Keep unfinished candles out of completed-candle rules
At 10:35, an hourly candle scheduled to end at 11:00 is still forming. A five-minute upward break at 10:35 cannot also be described as a completed hourly breakout.
Use the last completed context candle for a rule that explicitly requires a completed candle. If a method uses live intrabar information instead, say so and accept that the current high, low, and close can still change. Provider timezone, session boundaries, and weekend schedules can also change candle grouping.
A larger chart does not cancel a smaller stop
If the 111-based entry fails, switching to a daily chart and moving the stop to 100 creates a different trade with a different risk distance. The existence of more distant support does not preserve the original local premise.
Keep the chosen invalidation and position size attached to the setup that actually triggered. If the context remains constructive after a failed entry, a later setup still needs fresh evidence and a separate risk calculation.
For the next step, connect context to the simple pullback method. When the larger chart is a range, use its boundaries to limit expectations for a smaller breakout inside it.