Simple Pullbacks: Find a Clear Trend Restart
Recognize an orderly pullback in a strong trend, locate a compact pause, and use a renewed directional break without confusing it with prolonged consolidation.
Price Action: Trends, Pullbacks & Reversals
Browse the lessons
Bar relationships and channels
Pullbacks and trend development
- High 1, High 2, Low 1, Low 2: Count Pullback Attempts5 min read
- Simple Pullbacks: Find a Clear Trend Restart5 min read · You are here
- First Break vs. Second Break: Trade the Pullback Restart5 min read
- Complex Pullbacks and Two-Legged Corrections5 min read
- Spike-and-Channel and Stair-Step Trends: Read the Progress5 min read
Trading ranges and breakout structures
Reversals and chart patterns
- Major Trend Reversals: Read the Break, Test, and Turn4 min read
- Double Tops and Bottoms: Identify the Test and Neckline4 min read
- Head and Shoulders: Identify the Shape and Neckline Break4 min read
- Final Flags: Identify the Failed Last Push4 min read
- Wedges and Three Pushes: Identify the Reversal Setup4 min read
- Contracting and Expanding Triangles: Read the Boundaries4 min read
Measuring the next move
Favor the trend when the pullback stays orderly
A clear uptrend followed by a modest, orderly pullback favors an upward restart once buying reappears. In a downtrend, an orderly rebound favors renewed selling. The key is how the correction behaves relative to the move before it.
A simple pullback gives price room to pause without creating a large new battle over the same area. It can offer a more useful location than chasing a move after it has already travelled far. The opportunity comes from the combination of trend, location, and renewed direction—not from the mere presence of a red candle during a rise.
How to recognize a simple pullback
A simple pullback needs an identifiable reference trend. Use the following observations together.
| Feature | What to look for |
|---|---|
| Incoming trend | Clear progress in one direction, with earlier breaks receiving follow-through |
| Correction | A readable dip, rebound, or brief sideways pause |
| Overlap | Limited back-and-forth trading compared with the preceding trend movement |
| Location | A plausible support or resistance area associated with the trend |
| Restart | A completed signal followed by movement back in the trend's direction |
There is no universal maximum number of candles, hours, or legs. A short correction can be messy; a slightly longer one can remain orderly. Define simplicity by the clarity of the movement and the continued validity of the trend structure.
An upward example becomes less attractive when the pullback repeatedly attempts to recover but is immediately sold back down. Deep countertrend closes, expanding overlap, and loss of the relevant swing low are reasons to stop treating it as a prompt restart.
A compact pause near the moving average
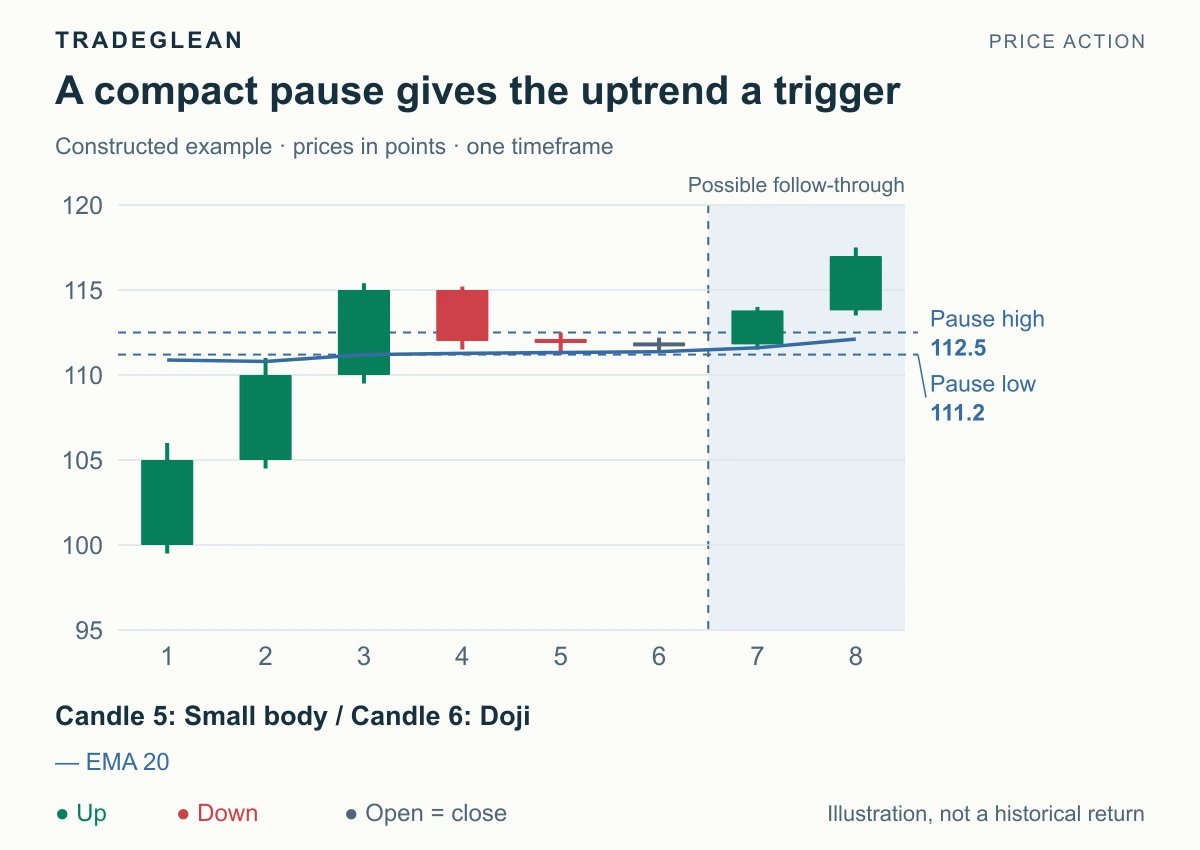
Constructed prices, green up and red down. The EMA20 uses 240 earlier closes at 111.5 followed by the displayed closes; it is calculated rather than drawn by eye.
The first three candles advance from 100 to a 115 close. Candle 4 pulls back, and candles 5–6 compress the movement. Candle 5 has a 0.2-point body; candle 6 opens and closes at 111.8. Together their range is 111.2–112.5.
The EMA20 is approximately 111.32 at candle 5 and 111.37 at candle 6, placing the pause around the average. The average helps describe location. It does not buy the market, hold the price up, or independently confirm that the correction has finished.
This is an application of the double-doji, or DD, idea: a compact cluster of small hesitation candles near the average during a clear trend pullback. The candles need not be two perfectly equal open-and-close crosses. Their small combined range and their position within the pullback matter more than an attractive nickname. The earlier doji guide covers the individual candle definitions.
Turn the pause into an upward setup
The combined high at 112.5 is the nearby restart reference. Candle 7 closes at 113.8, above it. The useful reading is now bullish resumption from the compact pause. Candle 8 then closes at 117, beyond the earlier 115.4 high.
For an entry method waiting for the pause-high break, mark the 111.2 pause low before considering execution. A plan based on the whole original trend holding would use a wider structure and different risk. The distinction should be made before entry, not after a pullback becomes uncomfortable.
The earlier trend high at 115.4 is the first visible obstacle. A move through it adds evidence of continuation. Until then, a recovery from the pause and a new trend high are separate achievements. This keeps a modest entry signal from being described as more than it has proved.
For a bearish version, look for a clear decline, a restrained upward correction near resistance or the average, and a downward break from the compact pause. Use the pause high as the corresponding structural reference.
When a simple pullback becomes something else
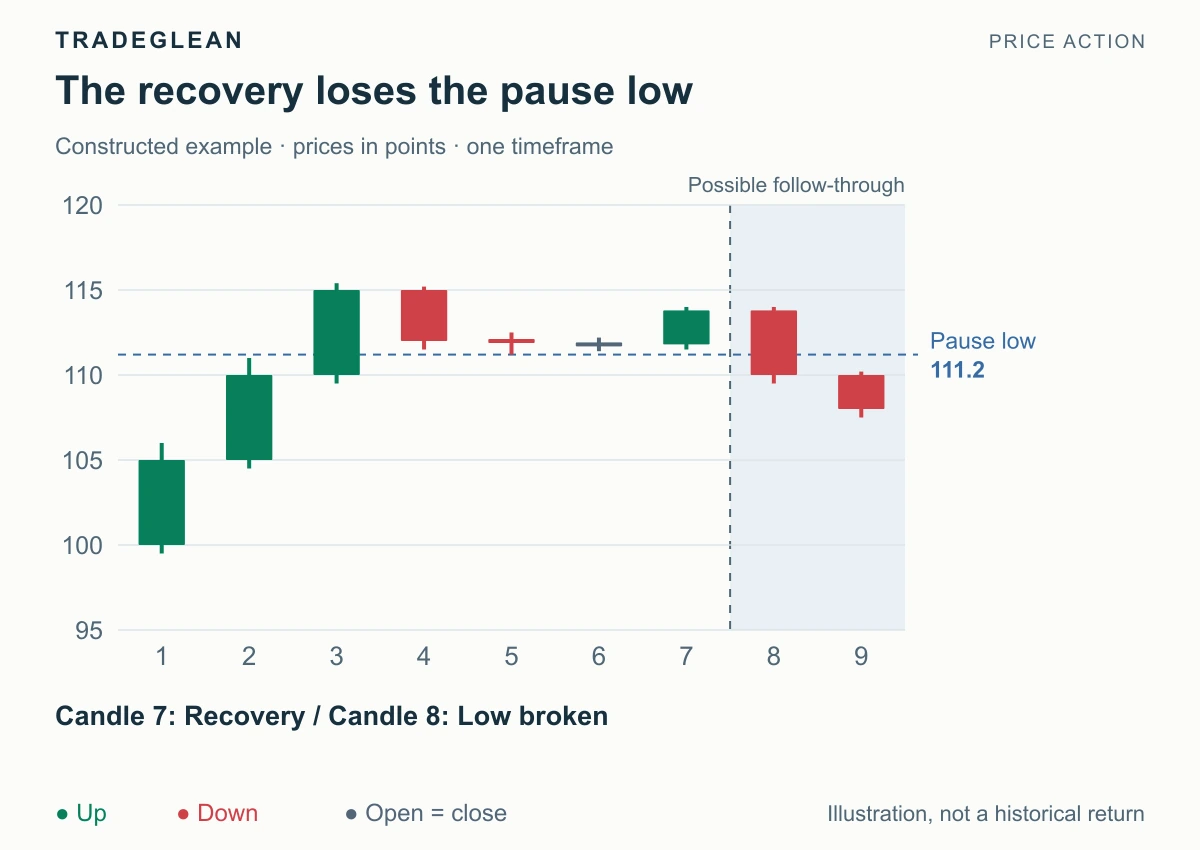
The same initial pause and restart are followed by a different constructed outcome.
After the 113.8 recovery close, candle 8 closes at 110, beneath the 111.2 pause low. The compact-pause continuation setup has failed. It is no longer reasonable to keep describing that low as support for the same plan.
The larger trend may survive a deeper correction, but that would require a new structural assessment. A broken narrow setup cannot borrow a much wider stop afterward simply because the original trend pointed upward. If prices begin alternating through the same area, examine a complex pullback or trading range.
A pause in the middle of a long-established range is another poor match. Even if its two candles look exactly like the DD example, the clear incoming trend and pullback location are missing. Describe it as local compression rather than forcing it into a trend-restart setup.
Keep the application focused
Use a primary timeframe for the trend, signal, and failure boundary. A smaller chart can show more swings within the pause, but those swings do not automatically replace the original setup. Changing scale after entry changes the question you are answering.
The practical sequence is short: identify the trend, locate the pullback, mark the compact structure, and wait for renewed directional movement. For the distinction between taking the first restart and waiting for another attempt, continue with first and second breaks.
Sources and terminology
DD terminology is associated with Bob Volman's Forex Price Action Scalping. This guide presents a simplified structural application with stated prices and EMA settings, not a reproduction of the book's complete execution system. Brooks' glossary supplies the broader pullback terminology.