Spike-and-Channel and Stair-Step Trends: Read the Progress
Distinguish a fast impulse followed by a channel from a trend built through successive ranges, and recognize when directional progress starts to weaken.
Price Action: Trends, Pullbacks & Reversals
Browse the lessons
Bar relationships and channels
Pullbacks and trend development
- High 1, High 2, Low 1, Low 2: Count Pullback Attempts5 min read
- Simple Pullbacks: Find a Clear Trend Restart5 min read
- First Break vs. Second Break: Trade the Pullback Restart5 min read
- Complex Pullbacks and Two-Legged Corrections5 min read
- Spike-and-Channel and Stair-Step Trends: Read the Progress5 min read · You are here
Trading ranges and breakout structures
Reversals and chart patterns
- Major Trend Reversals: Read the Break, Test, and Turn4 min read
- Double Tops and Bottoms: Identify the Test and Neckline4 min read
- Head and Shoulders: Identify the Shape and Neckline Break4 min read
- Final Flags: Identify the Failed Last Push4 min read
- Wedges and Three Pushes: Identify the Reversal Setup4 min read
- Contracting and Expanding Triangles: Read the Boundaries4 min read
Measuring the next move
A slower trend can still point in the same direction
An upward impulse followed by higher pullback lows remains a bullish structure, even when the advance slows into a channel. Successive ranges forming at higher prices also support an upward view. Reverse those relationships for bearish trends.
The distinction matters because strong movement does not always consist of consecutive large candles. A trend can advance rapidly, pause, then continue through smaller overlapping swings. It can also move in steps as one trading range breaks and another forms above or below it.
Describe what is making progress: individual candles, swing pivots, or whole ranges. That gives you a more useful directional reading than judging the latest body in isolation.
How to identify the two structures
| Structure | Recognition | Main directional evidence |
|---|---|---|
| Spike and channel | A fast directional impulse followed by a slower sloping sequence of swings | The channel continues to form higher lows in an uptrend or lower highs in a downtrend |
| Stair-step or trending ranges | An established range breaks, then another range forms in a shifted price area | New ranges hold progressively higher or lower locations |
Neither structure has a fixed number of candles. Identify the transition using actual changes in progress and overlap. A single small candle after a large one is not enough to establish a channel, and one close beyond a box does not prove a second range has formed.
Use the same timeframe when comparing the phases. A narrow channel on a larger chart can contain many smaller swings on a shorter chart. Those details do not automatically cancel the larger chart's direction.
Spike and channel: follow the swing lows
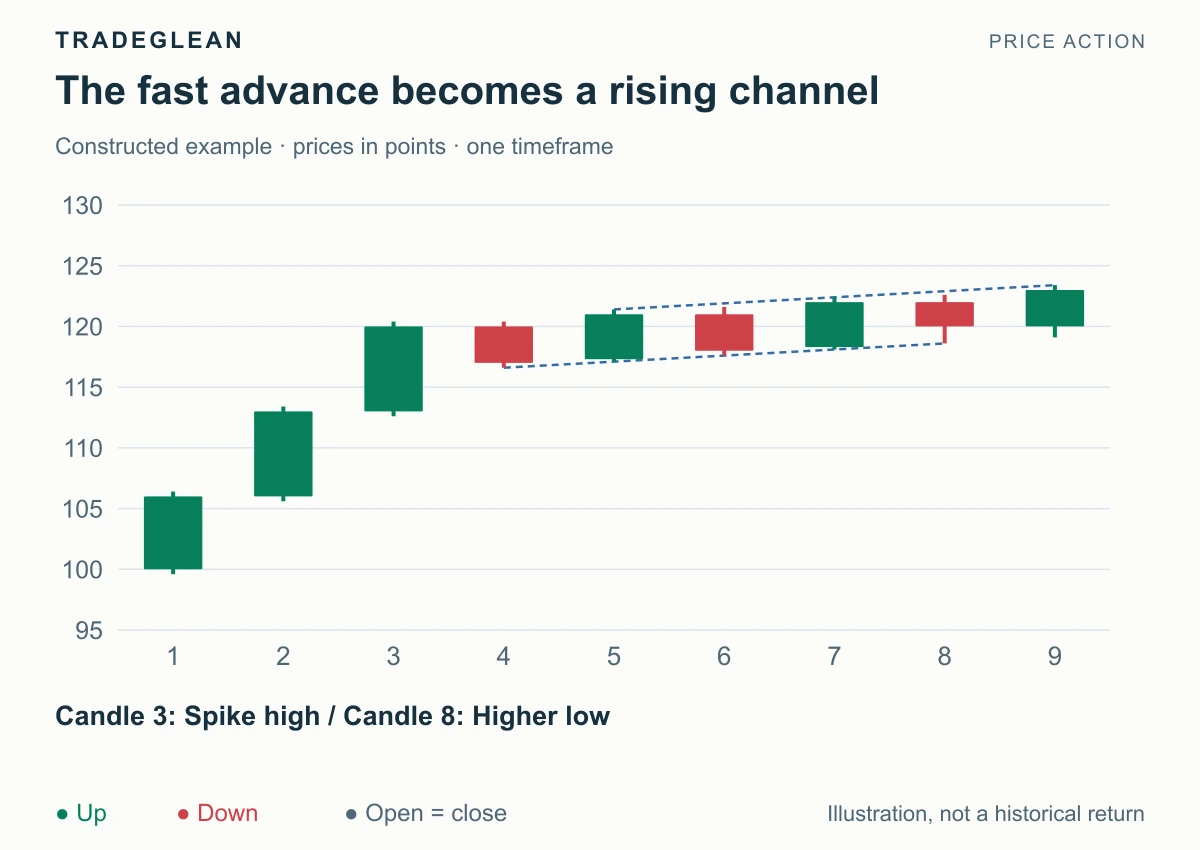
Constructed prices, green up and red down. The first three candles close at 106, 113, and 120.
The first phase advances quickly from 100. After the 120 close, the later pullbacks close at 117, 118, and 120, while subsequent advances reach progressively higher prices. The pace is less direct, but the sequence still supports a bullish reading.
The practical focus changes with that pace. During the fast impulse, an entry after a large candle may be far from a useful protective level. During the channel, a pullback gives a more defined local structure to inspect. A renewed upward signal near support fits the existing direction; a red candle within the pullback is not enough to declare a bearish trend.
The channel guide explains how to draw the boundaries. Here, the question is how the market's behavior has changed from the impulse to the slower phase.
In the bearish mirror, the initial decline becomes a series of lower rebound highs and lower lows. Slower selling still favors the downward view while those relationships remain intact.
Stair-step trends: entire ranges change location
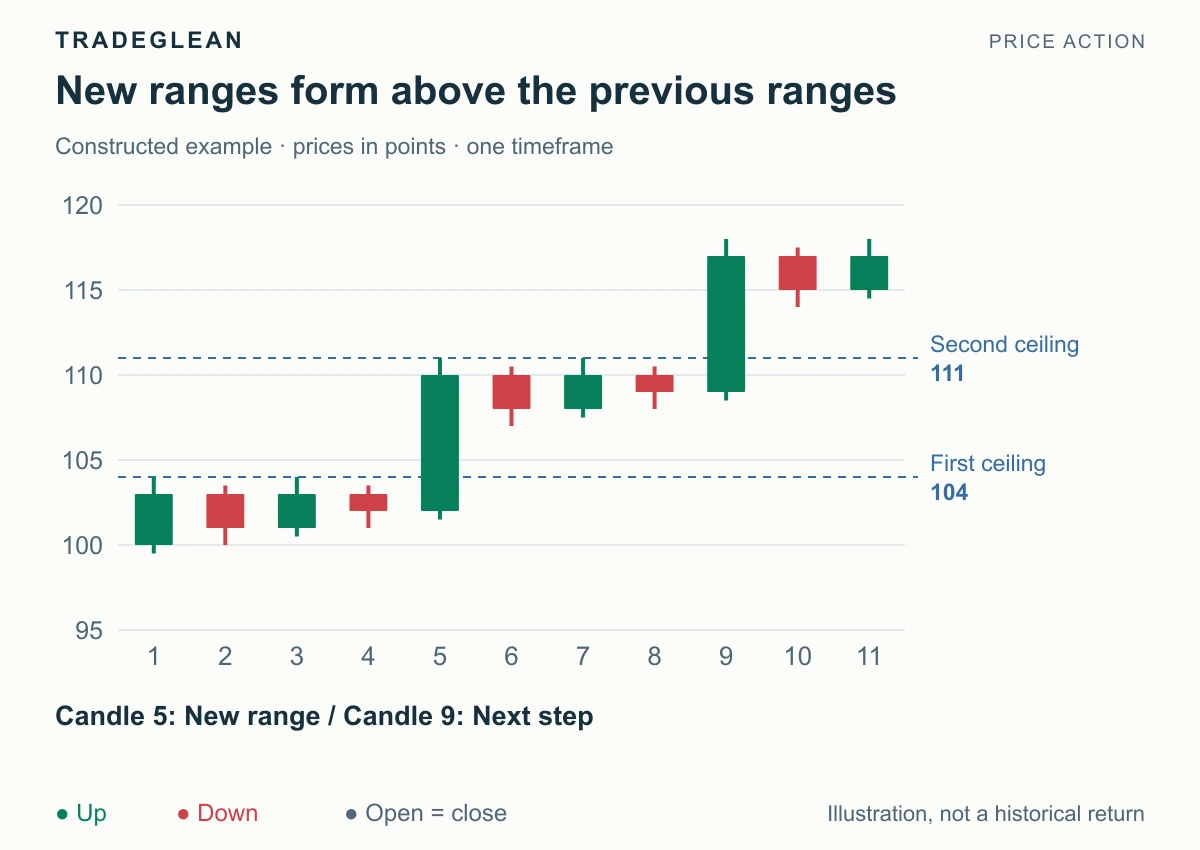
The first range has a ceiling at 104. Later consolidation forms around 107–111, then around 114–118.
Candles 1–4 trade in the first lower region. Candle 5 breaks above 104. Candles 6–8 then establish a higher pause, with the lowest displayed price in that pause at 107, above the old ceiling.
Candle 9 breaks above the next ceiling at 111. Candles 10–11 pause higher again, with a low at 114. The upward trend is expressed through the location of these ranges, even though several individual candles close red.
The useful bullish evidence is that the new consolidations retain higher ground. The next setup should be judged against the current range and nearby old boundaries. An entry based on the 107–111 range cannot keep using the first box's low near 100 as if nothing changed.
A descending stair-step trend works the same way in reverse: lower ranges hold beneath earlier floors. Favor downward continuation while those shifted structures remain intact and a valid trigger appears.
Recognize weakening without declaring an early reversal
Watch for shrinking extensions beyond previous extremes, deeper pullbacks, and repeated returns into old ranges. Those changes weaken the explanation that price is progressing efficiently in the original direction.
An uptrend that stops making progress may first become a trading range. To support a bearish reversal, look for additional evidence: important support breaks, a lower rebound high, and renewed downward follow-through. A reduced upward slope alone does not provide those events.
For a stair-step advance, a sustained return into the previous lower range is a material change. It suggests that the newer higher-price area has not held as expected. Treat the current setup's protective boundary as binding rather than enlarging the tolerated range after the fact.
Keep the near-term and larger views separate
A bearish reversal of a small pullback channel can occur within a larger downtrend and therefore help the larger trend resume. Likewise, a bullish reversal of a small downward correction can align with a larger uptrend. Always attach “bullish,” “bearish,” and “reversal” to a named timeframe or swing.
The same discipline applies to targets. A local continuation initially faces the next swing extreme or range boundary. Extending the target to a much larger move needs further structural support. The existence of a large trend does not remove a nearby obstacle from a smaller entry.
Further reading
The Brooks glossary includes spike-and-channel and trending-range terminology. When the repeated shifts stop and both sides return to the same prices, use the trading-range guide. For an actual opposite-direction structure, see major trend reversals.