Measured Moves: Calculate Targets from Price Structure
Calculate range-height, equal-leg, and head-height projections with clear starting points, then compare each target with the nearest visible obstacle.
Price Action: Trends, Pullbacks & Reversals
Browse the lessons
Bar relationships and channels
Pullbacks and trend development
- High 1, High 2, Low 1, Low 2: Count Pullback Attempts5 min read
- Simple Pullbacks: Find a Clear Trend Restart5 min read
- First Break vs. Second Break: Trade the Pullback Restart5 min read
- Complex Pullbacks and Two-Legged Corrections5 min read
- Spike-and-Channel and Stair-Step Trends: Read the Progress5 min read
Trading ranges and breakout structures
Reversals and chart patterns
- Major Trend Reversals: Read the Break, Test, and Turn4 min read
- Double Tops and Bottoms: Identify the Test and Neckline4 min read
- Head and Shoulders: Identify the Shape and Neckline Break4 min read
- Final Flags: Identify the Failed Last Push4 min read
- Wedges and Three Pushes: Identify the Reversal Setup4 min read
- Contracting and Expanding Triangles: Read the Boundaries4 min read
Measuring the next move
A measured move turns a visible price structure into a reference level. After a bullish break, add the chosen height to the relevant starting point. After a bearish break, subtract it.
The calculation answers “Where would an equal-sized move reach?” It does not establish the direction by itself or guarantee that price will reach the result. Determine the directional setup first, then measure its potential space.
Identify the measurement before calculating
Three useful methods use different starting points.
| Method | Distance to measure | Where to project from |
|---|---|---|
| Range height | Ceiling minus floor | The broken range edge |
| Equal legs | First leg's end minus its start, using direction consistently | The end of the intervening correction |
| Head height | Vertical distance between head and neckline | The neckline break area |
Use consistent prices. If a range is defined by wick extremes, measure those extremes rather than silently switching to closes to obtain a more attractive target.
The structure must also exist before you use it. The lowest point visible at the end of a finished chart was not necessarily a confirmed correction low when it first printed. Wait for the price behavior your method uses to identify the restart.
Project a range height from its edge
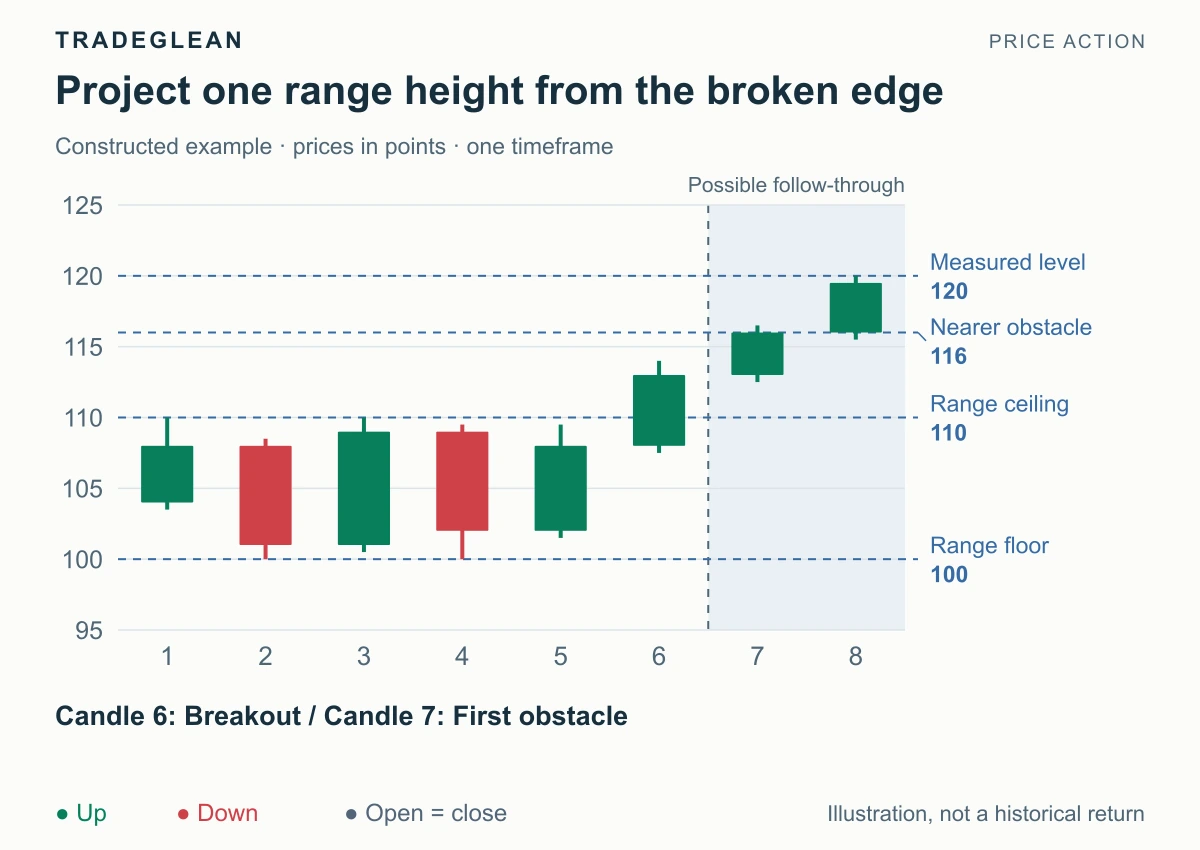
Constructed example. The 116 obstacle is assumed to have been marked from earlier price history outside this window. The shaded later candles illustrate a possible outcome; they are not used to establish that prior obstacle.
The range floor is 100 and its ceiling is 110. Its height is:
110 − 100 = 10 points
After an upward break, project those 10 points from the ceiling:
110 + 10 = 120
Candle 6 closes at 113, above the range. The 120 level is therefore a bullish range-height reference. It is not calculated as 113 + 10; the chosen method projects from the broken edge, not from the breakout candle's close.
The earlier obstacle at 116 comes first. From 113, that is 3 points away, while the measured level is 7 points away. The nearer level deserves attention even though the arithmetic extends farther.
For a downward break of the same range, the equivalent calculation would be 100 − 10 = 90. That bearish reference would only become relevant to a downward setup; it is not an alternative forecast attached to the displayed upward break.
Copy one leg from the correction's end
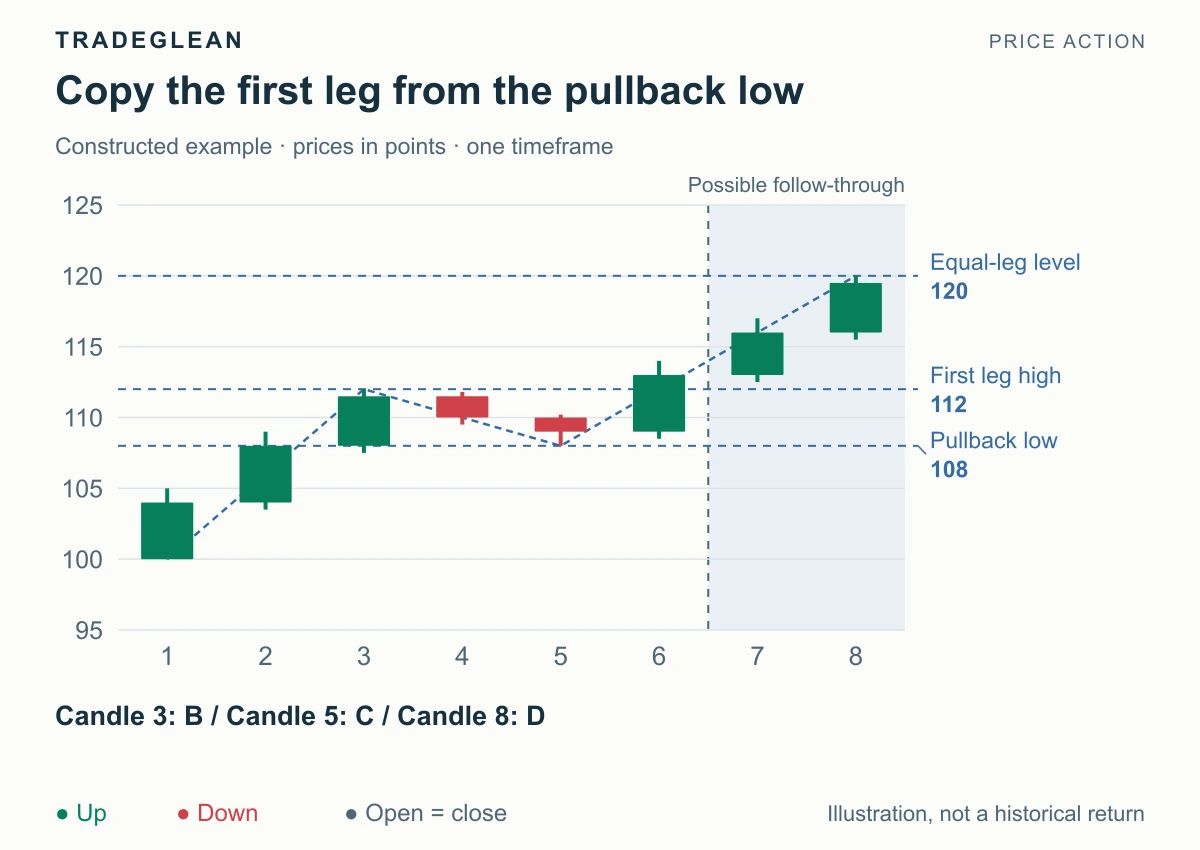
The first upward leg travels from 100 to 112, a distance of 12 points. The correction then reaches 108 on candle 5, before candle 6 resumes the advance.
Project the first leg's distance from the correction low:
108 + (112 − 100) = 120
The projection uses 108 because that is the end of the intervening correction. Starting from 112 would produce 124, which would be a different measurement.
“Equal” refers to price distance here. It does not mean the second leg must take the same number of candles, contain the same pullbacks, or travel at the same speed. For identifying the underlying legs, see Complex Pullbacks and Two-Legged Corrections.
Measure a head-and-shoulders height
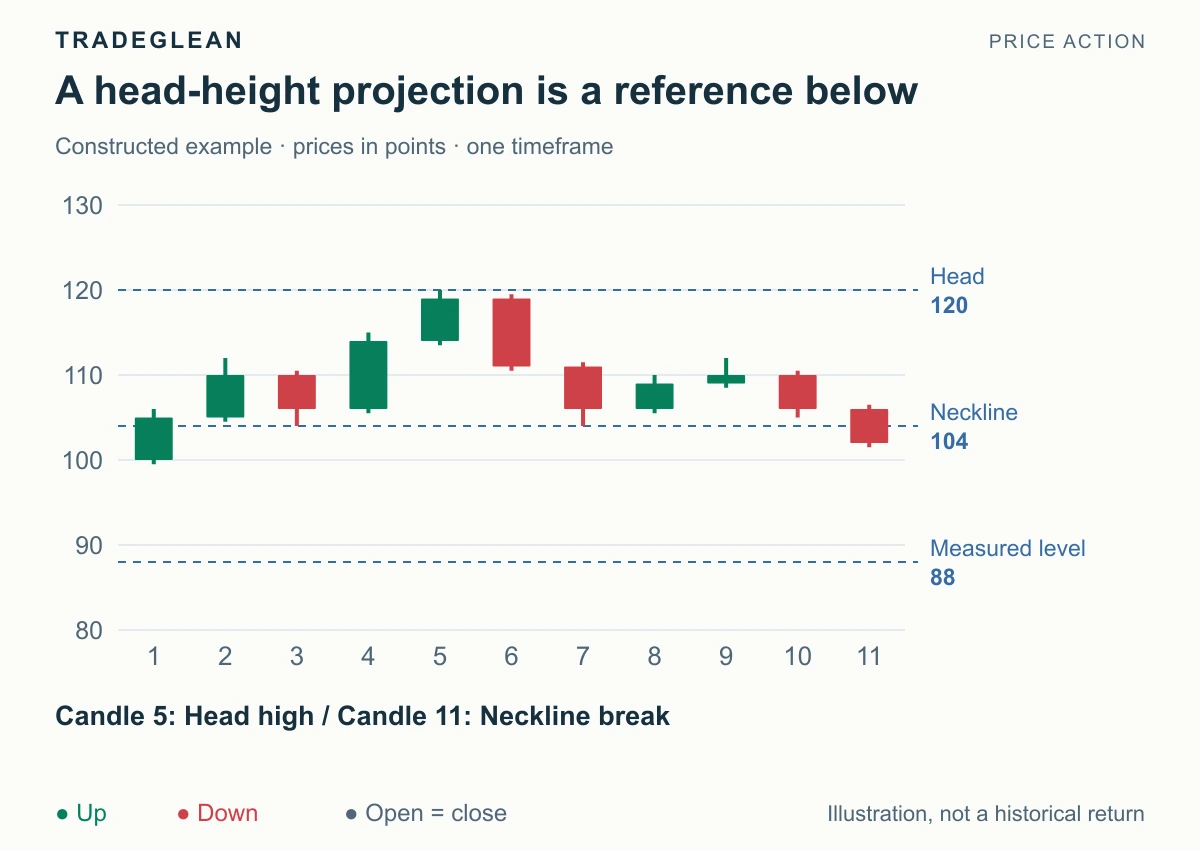
The head reaches 120, and the horizontal neckline is 104. The pattern height is 16 points.
After the downward neckline break, the projection is:
104 − (120 − 104) = 88
The chart stops shortly after the break. It deliberately does not show a completed fall to 88. That level is a calculated reference, not an observed result.
Earlier prices around 100 lie before 88 and may provide nearer support to inspect. The existence of a distant projection does not remove those areas. If the neckline slopes, state how you measure the vertical head-to-line distance and which breakout point supplies the projection; the horizontal example avoids that extra ambiguity.
Keep targets separate from evidence of success
Several projections can land near the same area because they share the same underlying swing. That overlap is not automatically independent confirmation or a statistical increase in success probability.
Keep the anchors fixed while evaluating the original setup. If the structure changes materially, retire that calculation and describe the new one. Repeatedly shifting the starting point to preserve an old target makes the method impossible to evaluate.
A useful target note contains three items: the calculation, the nearer obstacle, and the structural event that would cancel the setup. Detailed exit methods, partial positions, and trailing stops are separate decisions.
Further reading
StockCharts explains multi-leg structures in Measured Move — Bullish and Measured Move — Bearish. For recognizing the reversal before measuring it, see Head and Shoulders.