Contracting and Expanding Triangles: Read the Boundaries
Distinguish contracting and expanding price structures, identify their actual boundaries, and read the confirmed breakout without guessing from the outline.
Price Action: Trends, Pullbacks & Reversals
Browse the lessons
Bar relationships and channels
Pullbacks and trend development
- High 1, High 2, Low 1, Low 2: Count Pullback Attempts5 min read
- Simple Pullbacks: Find a Clear Trend Restart5 min read
- First Break vs. Second Break: Trade the Pullback Restart5 min read
- Complex Pullbacks and Two-Legged Corrections5 min read
- Spike-and-Channel and Stair-Step Trends: Read the Progress5 min read
Trading ranges and breakout structures
Reversals and chart patterns
- Major Trend Reversals: Read the Break, Test, and Turn4 min read
- Double Tops and Bottoms: Identify the Test and Neckline4 min read
- Head and Shoulders: Identify the Shape and Neckline Break4 min read
- Final Flags: Identify the Failed Last Push4 min read
- Wedges and Three Pushes: Identify the Reversal Setup4 min read
- Contracting and Expanding Triangles: Read the Boundaries4 min read · You are here
Measuring the next move
A contracting triangle narrows as price makes lower highs and higher lows. An expanding structure widens as price makes higher highs and lower lows.
These shapes describe how swings are changing. To make a directional call, combine the preceding move with the edge being tested and the actual breakout. In the first example below, an upward break after an advance establishes the bullish continuation case. In the second, a break beneath prior support establishes a bearish move within a broadening structure.
How to identify the two structures
| Feature | Contracting triangle | Expanding structure |
|---|---|---|
| Upper reaction points | Progressively lower | Progressively higher |
| Lower reaction points | Progressively higher | Progressively lower |
| Distance between edges | Narrows | Widens |
| Common visual error | Drawing lines through arbitrary candle bodies | Calling any volatile range an expanding pattern |
| Key next observation | Which edge breaks and holds | Which actual swing or boundary breaks and holds |
Use at least two meaningful points on each side to establish the lines. More contacts help show that the shape is a repeated relationship rather than a coincidence.
Not every contracting triangle has two sloping sides. Ascending and descending variants have one flatter boundary. This article concentrates on the two-sided contraction illustrated here, keeping it distinct from the range-edge squeeze.
A contracting triangle resolves upward
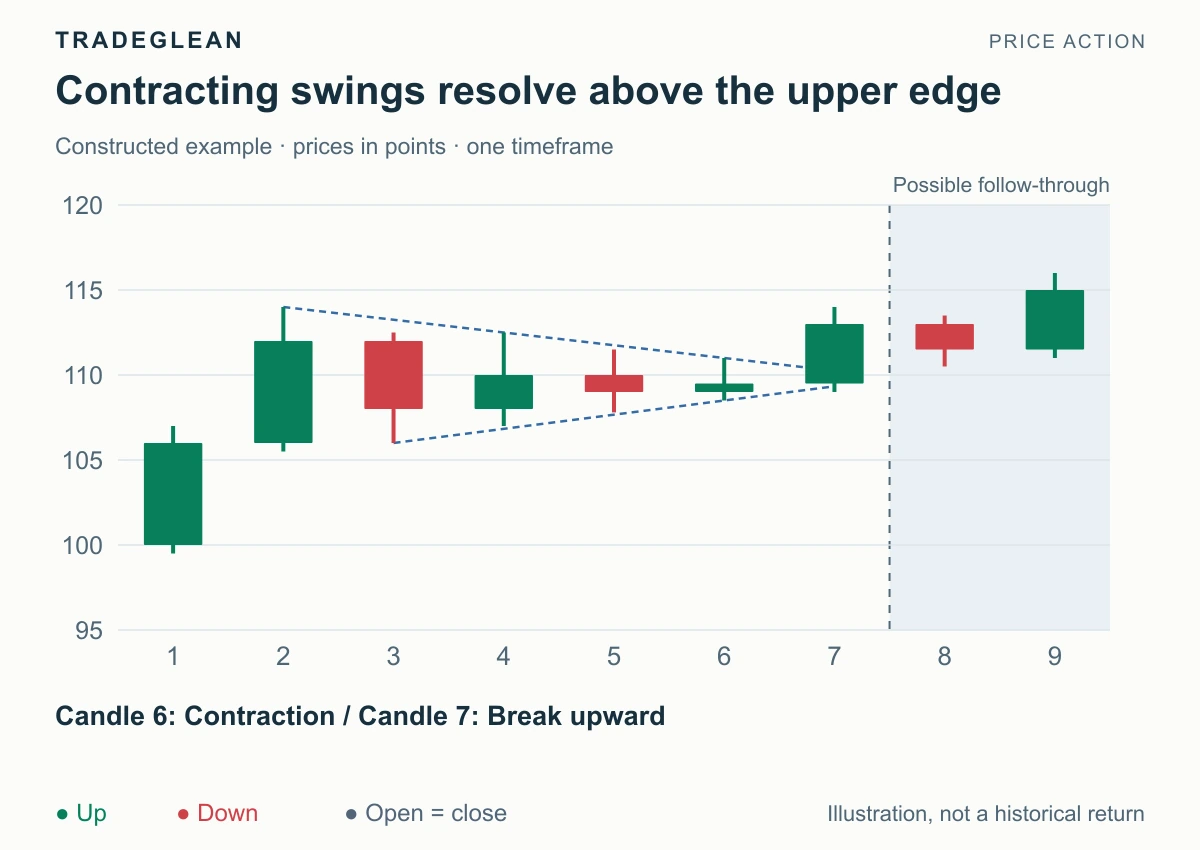
Constructed price geometry. The diagram illustrates a compact structure, not every duration or volume condition used in classical chart-pattern analysis.
The initial advance is followed by progressively lower upper extremes: 114, 112.5, and 111 on candles 2, 4, and 6. Pullbacks remain at higher levels, including lows of 106, 107, and 108.5 on candles 3, 4, and 6.
At candle 7, the upper line is approximately 110.25. The candle closes at 113, clearly above it. Because the setup follows an advance and has now broken upward, the preferred interpretation is bullish continuation.
Candle 8 pulls back to a low of 110.5 and closes at 111.5. Candle 9 then closes at 115, showing renewed upward progress.
The pullback is near the price area where the upper boundary was broken. Do not extend two converging lines beyond their intersection and pretend that the resulting inverted space is still the original triangle.
Recognize a failed contracting-triangle break
A single wick through the upper line followed by a close inside is not the same event as the close at 113. Even after a closing break, a sustained return into the old consolidation weakens the breakout.
Keep the reference tied to actual swing levels and the original boundary at the time of the break. If price later moves below the triangle's higher-low structure, the bullish continuation premise has suffered more than a shallow retest.
The same method applies to a downward closing break: use the lower boundary and subsequent price behavior to establish the bearish case. The word “triangle” does not choose the direction in advance.
An expanding structure breaks prior support
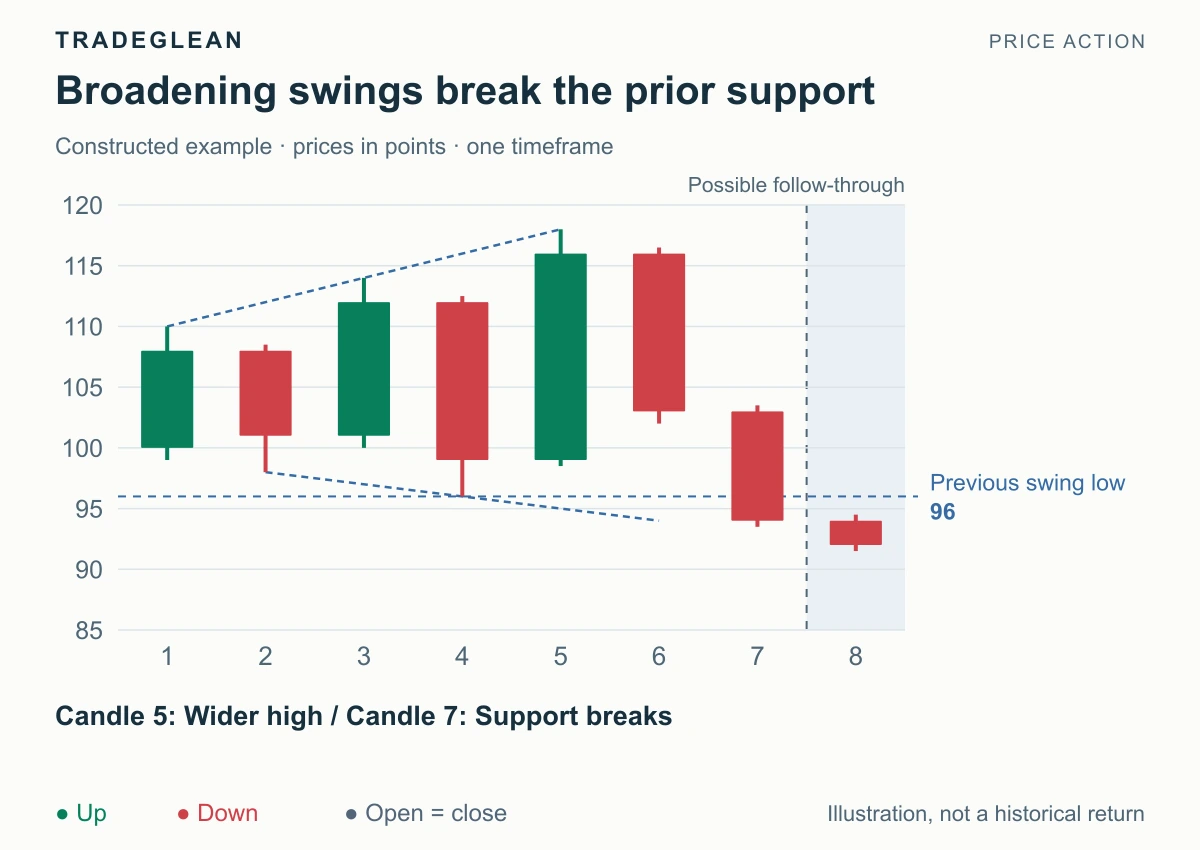
The upper tests reach 110, 114, and 118. The earlier lower tests reach 98 and 96. These outward-moving extremes define the broadening relationship.
After the 118 high, price falls back. Candle 7 closes at 94, below the previous swing low of 96. Candle 8 closes at 92, supporting the bearish reading.
Be precise about the trigger: candle 7 breaks the horizontal prior low at 96. It does not close below the extrapolated lower diagonal, which would be approximately 93 at that point. Those are separate thresholds, and the diagram should not be used to claim both.
Wider swings change the available space
An expanding formation can make individual moves look impressive while repeatedly sending price back across earlier levels. The increased range also means that a structural invalidation level can be farther from an entry.
First identify the setup's own boundary and the next obstacle. Then use the existing trading-plan guide if you need to translate that distance into position size. A wider pattern is not automatically a stronger or more profitable signal.
If the illustrated bearish break were followed by sustained recovery above 96, the support-break premise would weaken. A new advance through the opposite side would require a fresh directional assessment.
Further reading
StockCharts' Symmetrical Triangle covers the classical contracting pattern. The examples here keep the identification, chosen breakout level, and later confirmation separate so the conclusion can be checked against the displayed prices.