Build a Trading Plan from a Bullish or Bearish Signal
Turn a directional candlestick signal into a complete practice plan: identify the pattern, define an entry, set the failure boundary, and calculate size.
Candlestick Reading for Beginners
Browse the lessons
The foundations
Reading a single candle
Reversal combinations
Momentum, continuation & breakouts
- Wick Reclaims: Read Bullish and Bearish Continuation5 min read
- Three-Candle Continuation: Identify the Next Push5 min read
- Three White Soldiers and Black Crows: Read the Direction5 min read
- Rising and Falling Three Methods: Spot Trend Continuation5 min read
- Breakout Candles: Identify Bullish and Bearish Breaks5 min read
Start with the direction, then make the decision executable
A useful plan begins with a clear view: bullish recovery from support, bearish rejection at resistance, or continuation of the existing trend. The candle pattern supplies the signal; the surrounding chart explains why it matters there.
Then put five items into numbers: entry trigger, invalidation, protective order, next obstacle, and position size. The result should tell you what to do if the expected move starts and when to abandon the idea if it does not.
All prices, budgets, and fills in this article are paper-trading examples. Green candles close above their opens and red candles below. They illustrate a method of planning, not a measured profitable strategy.
What qualifies as the signal in this walkthrough?
The main example uses a bullish engulfing pattern: two adjacent candles after a decline, first red and then green, with the second body covering the first. Its primary reading at support is an upward recovery.
| Recognition check | Example |
|---|---|
| First body | Candle 4 falls from 103.2 to 102 |
| Second body | Candle 5 rises from 101.8 to 103.6 |
| Coverage | 101.8–103.6 extends beyond both ends of 102–103.2 |
| Location | Pullback into the assumed support area near 101–102 |
| Primary direction | Bullish recovery |
The combined low is 101.2 and the highest price in the pair is 103.8. See the full engulfing identification guide for body, wick, and shared-edge examples.
A complete bullish practice plan
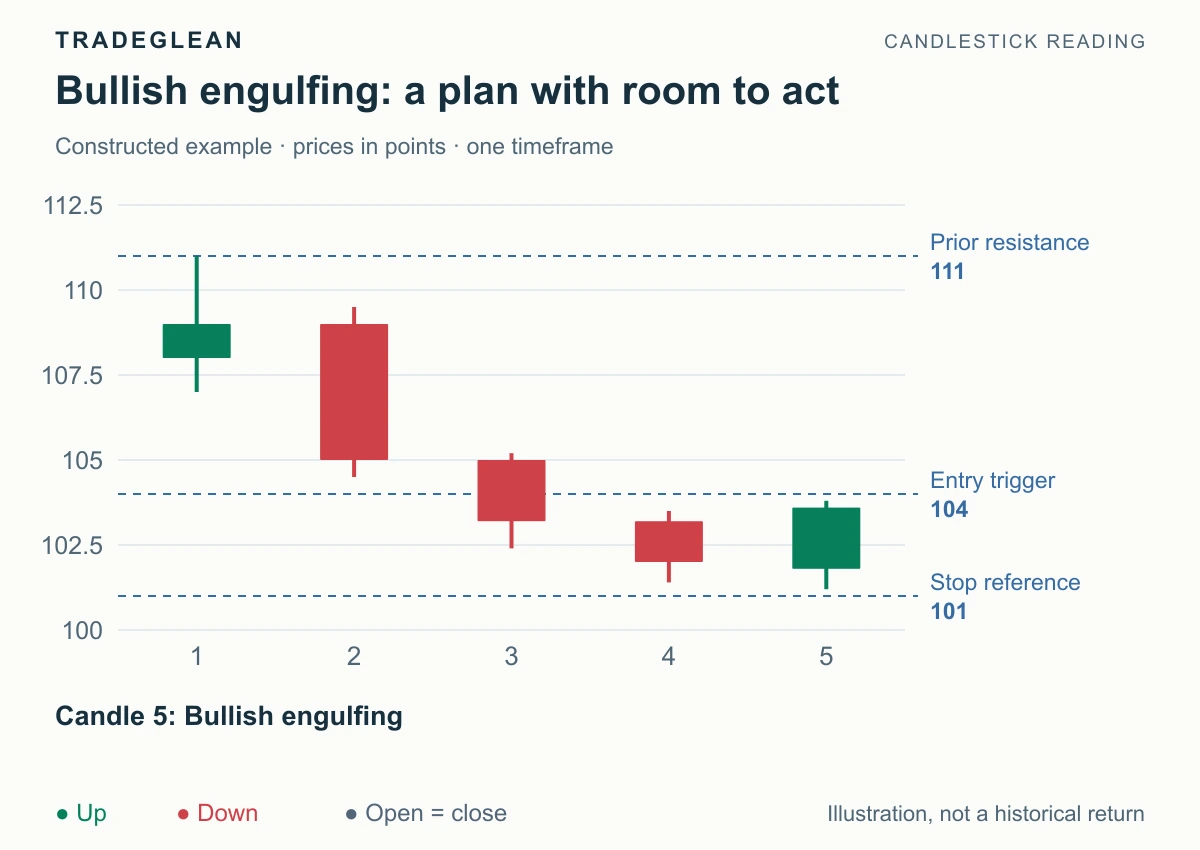
Constructed decision chart, paused after candle 5. For this exercise, support near 101–102 and resistance at 111 were identified beforehand, with no separate intervening resistance zone in the supplied context.
The engulfing body has shifted the local reading upward. The plan is to act only if price clears the pair high, using 104 as the paper-trading trigger. The stop reference is 101, below the 101.2 pattern low. A first target at 110 sits before the known resistance at 111.
| Plan item | Rule for this example |
|---|---|
| Bias | Bullish recovery from support |
| Entry trigger | Trade through 104 after the pattern completes |
| Protective reference | 101, below the pattern low |
| First target | 110, before resistance at 111 |
| Unfilled cancellation | Price reaches 101 first, or no entry during the next two candles |
| Review | Keep the original risk calculation; do not widen the stop |
Initial price risk is 104 − 101 = 3 points. The target distance is 110 − 104 = 6 points, or 2R. Space to resistance at 111 is 7 points, about 2.33R. Here, the direction, trigger, protection, and available space fit together.
For a simple simulation, assume a buy-stop entry at 104 with execution at that price if reached without a gap, then protective and target orders. Real execution depends on liquidity and the order type; a stop trigger is not a guaranteed fill price.
Apply the same planning steps to a bearish setup
A shooting star or bearish engulfing pair at resistance starts with a downward view. Put the entry condition below the signal, protection above the rejected high, and the target before the next support.
For separate arithmetic, entry 116, stop reference 120, and target 108 give 4 points of risk and 8 of reward, or 2R. This short-side example assumes the product permits that position and has a linear price-to-profit relationship. Borrowing rules, contract values, and costs belong in the actual plan.
The pattern's exact recognition rules still matter. A long upper wick after a rally and a bullish inverted hammer after a decline are different setups; use the appropriate identification guide.
Size the position from the stop distance
For the bullish example, assume one currency unit of profit or loss per point per unit held. With 3 points of price risk and estimated round-trip costs of 0.20 per unit, a practice budget of 100 allows:
Whole-unit quantity = floor(100 ÷ 3.20) = 31.
Price risk is 31 × 3 = 93. Estimated costs are 6.20, making the planned total 99.20. Thirty-two units would require 102.40 and exceed the stated budget.
The money amount 100 is an arbitrary teaching budget, not an account-risk recommendation. Products with multipliers, currency conversion, or nonlinear payoffs require their own calculation. Margin is a deposit supporting exposure; it is not the maximum loss. CME's position-size guide explains the relationship between stop distance and quantity.
When the direction is clear but the entry is poor
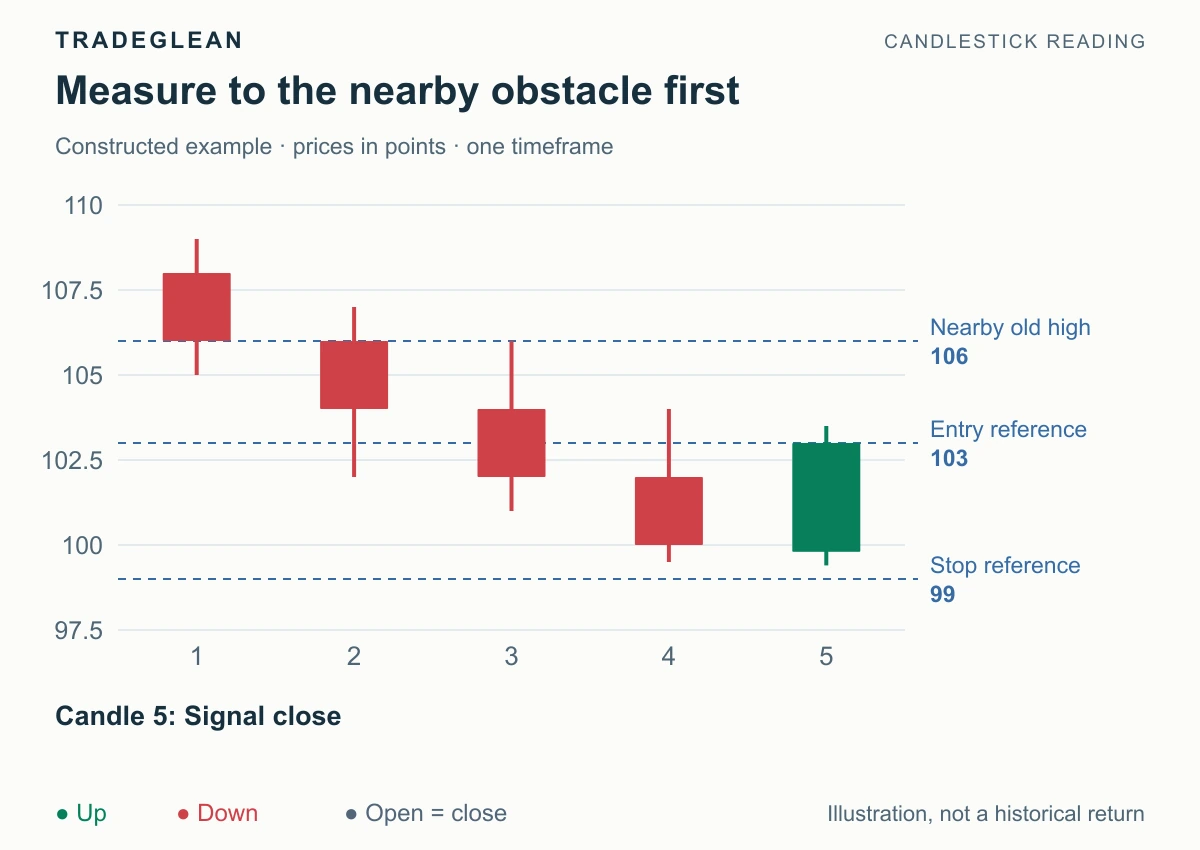
This is a separate, crowded chart. The earlier reaction at 106 is part of its decision-time context.
Entry 103 and a stop reference of 99 risk 4 points, while the old high at 106 leaves 3 points, or 0.75R. This entry fails an illustrative minimum-space requirement of 1.5R. The conclusion is bullish recovery signal, no entry under this space rule.
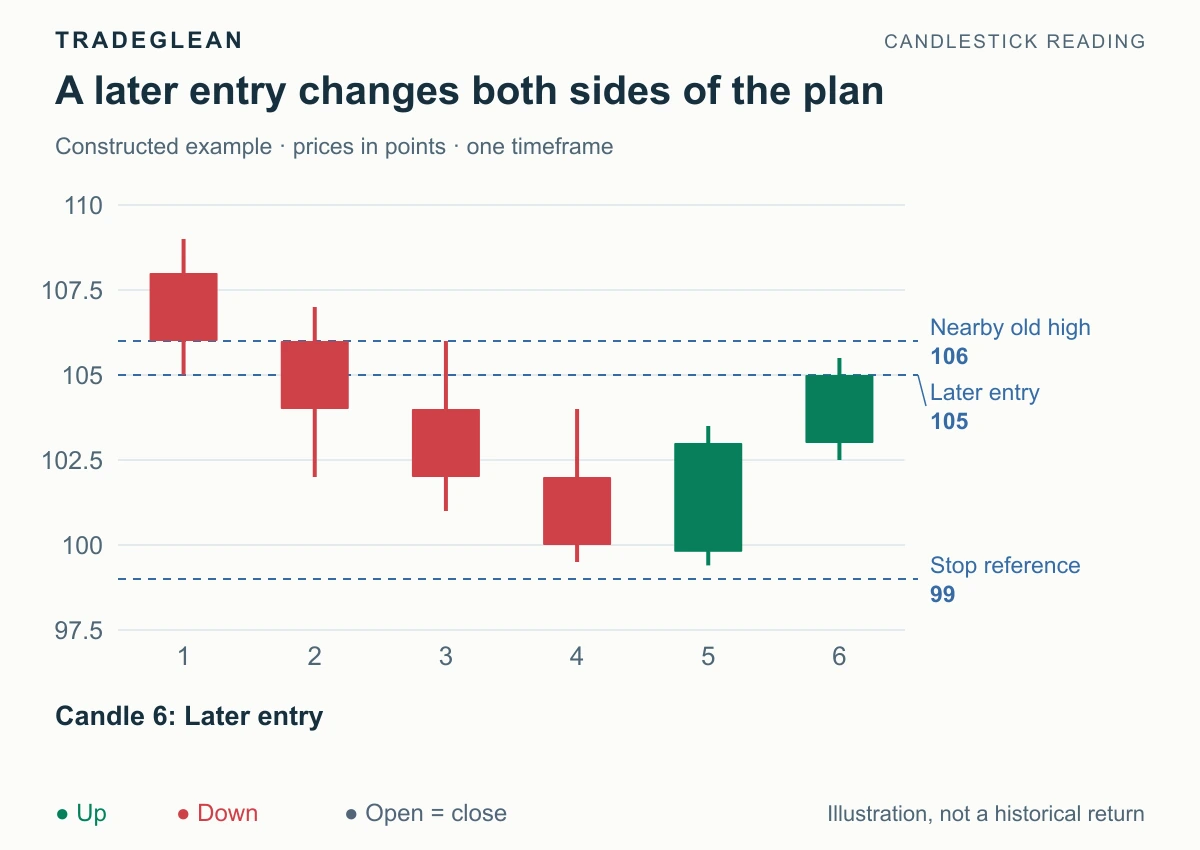
The changed entry must use a changed risk calculation.
At 105 with the same 99 stop reference, the space ratio falls to 1 ÷ 6 ≈ 0.17R. Waiting for more upward movement has made this particular entry worse. A future breakout and retest may create a different structure; do not assign yourself a tighter stop before that structure exists.
Keep the failure rule and the result consistent
For the main bullish plan, the recovery thesis depends on the low holding. A protective stop can trigger during the candle; a separate plan to inspect the close does not cancel that execution. FINRA explains that stop orders can fill away from their trigger, while stop-limit orders may remain unfilled. FINRA: Order Types.
Record results against the original money risk. In the 31-unit example, initial money R is 93. If all units exit at the 110 target, gross profit is 186, or 2R. After the estimated 6.20 costs, net profit is 179.80, about 1.93R. This is assumed execution arithmetic, not historical performance.
If only half exits at 2R and half at the entry, the whole position earns 1R gross. Keep the original denominator even if protection moves later.
Check your plan
Can the main bullish setup be described as “buy because the candle is green”?
Answer: No. It is a completed engulfing recovery at a stated support area, with a defined trigger above the pair, a low that must hold, room toward resistance, and quantity calculated from risk. Those conditions are what make the directional view usable.
Practice that sequence with chart replay, where you record the view before revealing the outcome.