How to Read Candlesticks: Bodies, Wicks, and Direction
Read green and red candles, spot buying and selling pressure, and use the close and nearby price levels to form a clear directional view.
Candlestick Reading for Beginners
Browse the lessons
The foundations
Reading a single candle
Reversal combinations
Momentum, continuation & breakouts
- Wick Reclaims: Read Bullish and Bearish Continuation5 min read
- Three-Candle Continuation: Identify the Next Push5 min read
- Three White Soldiers and Black Crows: Read the Direction5 min read
- Rising and Falling Three Methods: Spot Trend Continuation5 min read
- Breakout Candles: Identify Bullish and Bearish Breaks5 min read
Read the close to see which side made progress
A large green body closing near its high shows upward pressure during that period. A large red body closing near its low shows downward pressure. A long wick shows where price reached but could not hold into the close. These are the first clues you use to build a bullish or bearish reading.
Bullish means you favor an upward move; bearish means you favor a downward move. Start with the candle's message, then check whether it supports the trend or rejects an important level. That turns a chart from a collection of shapes into something you can read.
Throughout this collection, green means the close is above the open, red means it is below, and gray marks an exact match. The charts use constructed examples rather than historical trades.
Four prices tell you how to draw the candle
Every completed candle records the open, high, low, and close, often shortened to OHLC.
| Price | Meaning |
|---|---|
| Open | Where the period began |
| High | The highest price reached |
| Low | The lowest price reached |
| Close | Where the period finished |
On an hourly chart, those prices summarize one hour. On a daily chart, they summarize the daily session defined by the data provider. Choose a timeframe before interpreting a pattern and use completed candles: the current candle is still changing.
The thick rectangle is the body, which joins the open and close. The thin wicks, also called shadows, extend from the body to the high and low.
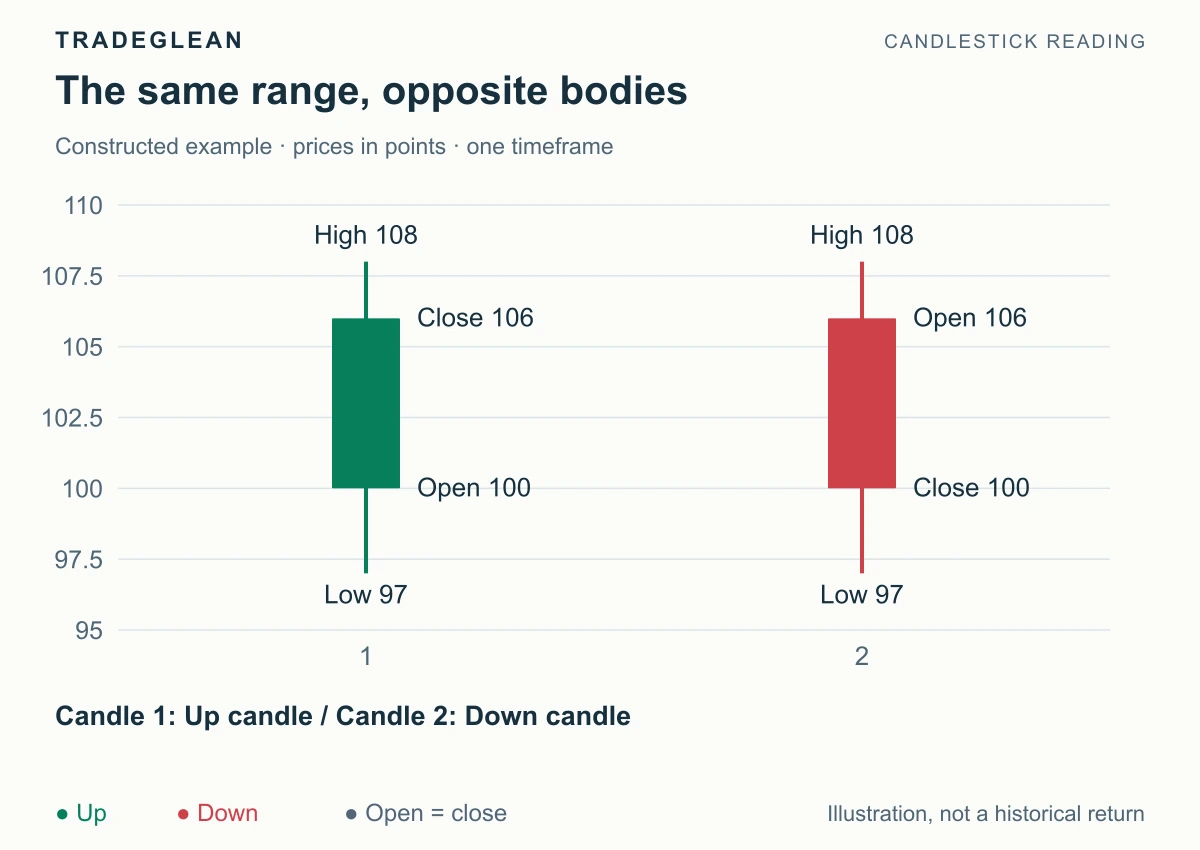
Equal time periods and arbitrary price points. The green candle opens at 100 and closes at 106; the red candle opens at 106 and closes at 100.
Both have a high of 108 and a low of 97. Each body is 6 points long, the upper wick is 2, and the lower wick is 3. Together they make the 11-point range.
For either color, calculate the body as the absolute open-to-close difference. The upper wick is the high minus the higher body edge; the lower wick is the lower body edge minus the low. On a red candle, the upper body edge is the open.
Turn the shape into a useful first reading
Compare the candle with its neighbors on the same market and timeframe. A six-point body means much more when nearby bodies are one point long than when they are ten.
| What you see | Initial reading | Where to apply it |
|---|---|---|
| Large green body, close near the high | Upward pressure | An uptrend resuming or a close above resistance |
| Large red body, close near the low | Downward pressure | A downtrend resuming or a close below support |
| Long lower wick, close near the top | Lower prices were rejected into the close | A bullish response at support or after a pullback |
| Long upper wick, close near the bottom | Higher prices were rejected into the close | A bearish response at resistance or after a rally |
| Small body with two substantial wicks | Directional progress has slowed | A pause whose location and next boundary break matter |
The wick rows are location-based readings, not names for every long-wick candle. Later lessons distinguish patterns whose interpretation changes with the preceding move.
Strong closes give you a direction to follow
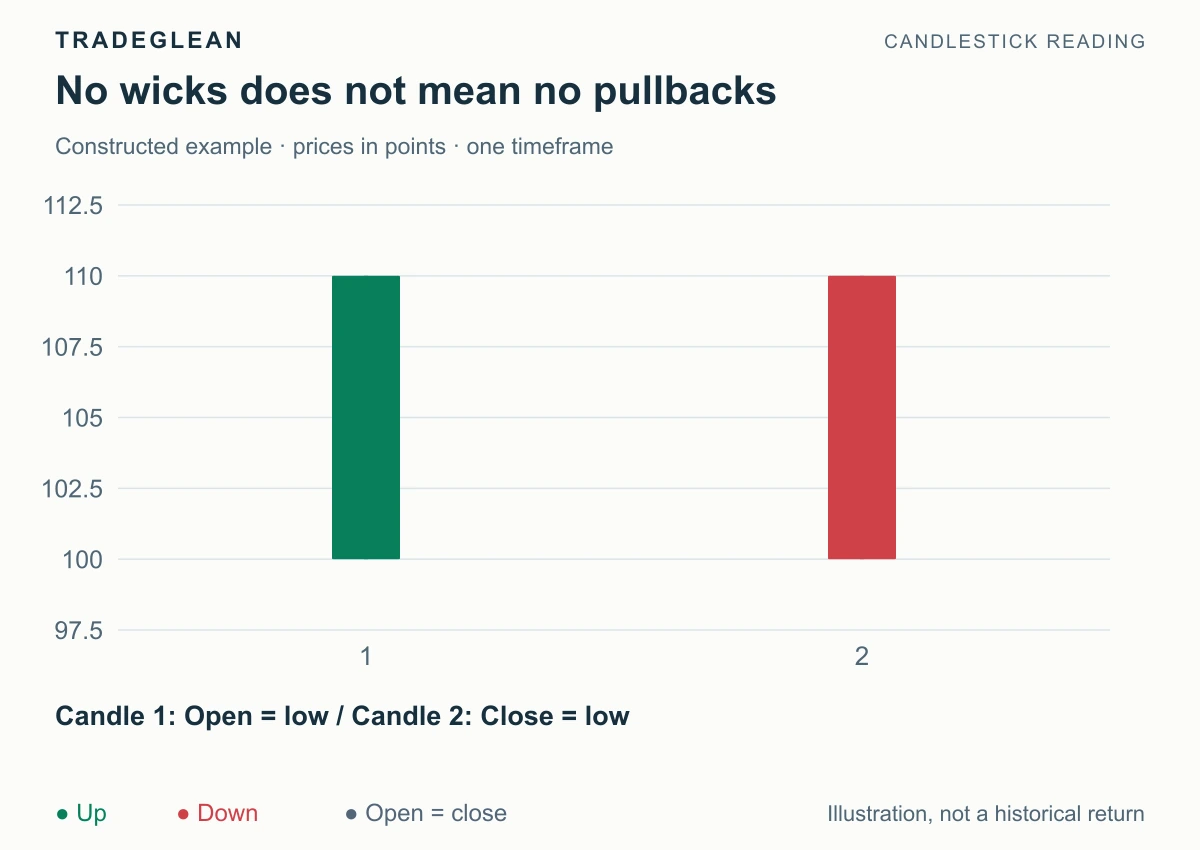
The green candle runs from 100 to 110; the red candle runs from 110 to 100.
The green candle finishes at its high. In an existing uptrend, that supports looking for the advance to continue. A pullback that holds the broken level or the last higher low keeps that reading intact. A close back below the breakout level weakens it.
The red candle finishes at its low. In a downtrend, that supports looking for lower prices, with rallies into a broken support area offering a place to check whether selling resumes.
Wickless candles are often called marubozu. They show a strong finish, although price may still have moved back and forth within the period. For example, 100 → 106 → 102 → 110 produces the green wickless candle shown here.
Give the reading a boundary
Suppose an hourly chart has rising swing highs and lows. A large green candle closes above a previously marked resistance area. A useful note is: “Bullish continuation while price holds above the broken area; watch for a higher low on the next pullback.”
That is a directional view with a reason and a condition. A single green hour inside a steep decline is a different setup: check whether it actually breaks the downward structure before treating it as an upward reversal.
Candle color compares the close with its own open, not necessarily the preceding close. Also, OHLC cannot show the exact order of every intraperiod move. Keep those details separate from the practical message of the completed candle.
Try a directional reading
A candle opens at 50, reaches 58, falls to 47, and closes at 49. It appears after a rally into established resistance. What deserves attention?
Answer: The red body is 1 point, the upper wick is 8, and the lower wick is 2. The rejection of higher prices at resistance gives a bearish warning. Watch for a close below 47 to support a downward move; a recovery above 58 would contradict that rejection setup.
Next, use trend and location to decide which candle signals deserve priority.
Reference
StockCharts: Introduction to Candlesticks covers OHLC construction and candle terminology. Directional examples here are educational interpretations, not measured win rates.