Wedges and Three Pushes: Identify the Reversal Setup
Identify rising and falling wedges, count three pushes with intervening pullbacks, and distinguish a confirmed reversal from a failed reversal attempt.
Price Action: Trends, Pullbacks & Reversals
Browse the lessons
Bar relationships and channels
Pullbacks and trend development
- High 1, High 2, Low 1, Low 2: Count Pullback Attempts5 min read
- Simple Pullbacks: Find a Clear Trend Restart5 min read
- First Break vs. Second Break: Trade the Pullback Restart5 min read
- Complex Pullbacks and Two-Legged Corrections5 min read
- Spike-and-Channel and Stair-Step Trends: Read the Progress5 min read
Trading ranges and breakout structures
Reversals and chart patterns
- Major Trend Reversals: Read the Break, Test, and Turn4 min read
- Double Tops and Bottoms: Identify the Test and Neckline4 min read
- Head and Shoulders: Identify the Shape and Neckline Break4 min read
- Final Flags: Identify the Failed Last Push4 min read
- Wedges and Three Pushes: Identify the Reversal Setup4 min read · You are here
- Contracting and Expanding Triangles: Read the Boundaries4 min read
Measuring the next move
A rising wedge carries a bearish reversal bias when an advance compresses between converging boundaries and then breaks support. A falling wedge carries the bullish mirror: downward progress narrows, then price breaks resistance.
The three-push view helps organize those attempts. It does not mean “three candles, then reverse.” Each push is a swing and can contain many candles. The intervening pullbacks are what separate one attempt from the next.
How to identify a wedge and count its pushes
For a rising wedge, mark successive higher highs and higher lows. The lower boundary rises faster than the upper boundary, reducing the space between them. For a falling wedge, both boundaries slope down, but the upper boundary falls faster so the space also narrows.
| Feature | What to verify |
|---|---|
| Pushes | Distinct advances or declines separated by counter-moves |
| Boundaries | Lines supported by actual reaction points |
| Convergence | The distance between the boundaries decreases |
| Reversal trigger | Price breaks the boundary opposite the wedge's direction |
| Follow-through | Price continues away instead of immediately reclaiming the pattern |
Three pushes can occur without a tidy geometric wedge. In that case, describe a three-push structure rather than drawing converging lines that the prices do not support.
Conversely, the broader classical wedge definition does not require exactly three perfectly symmetric swings. This guide uses three-push examples because they make the weakening sequence easy to see.
A rising wedge gives a bearish break
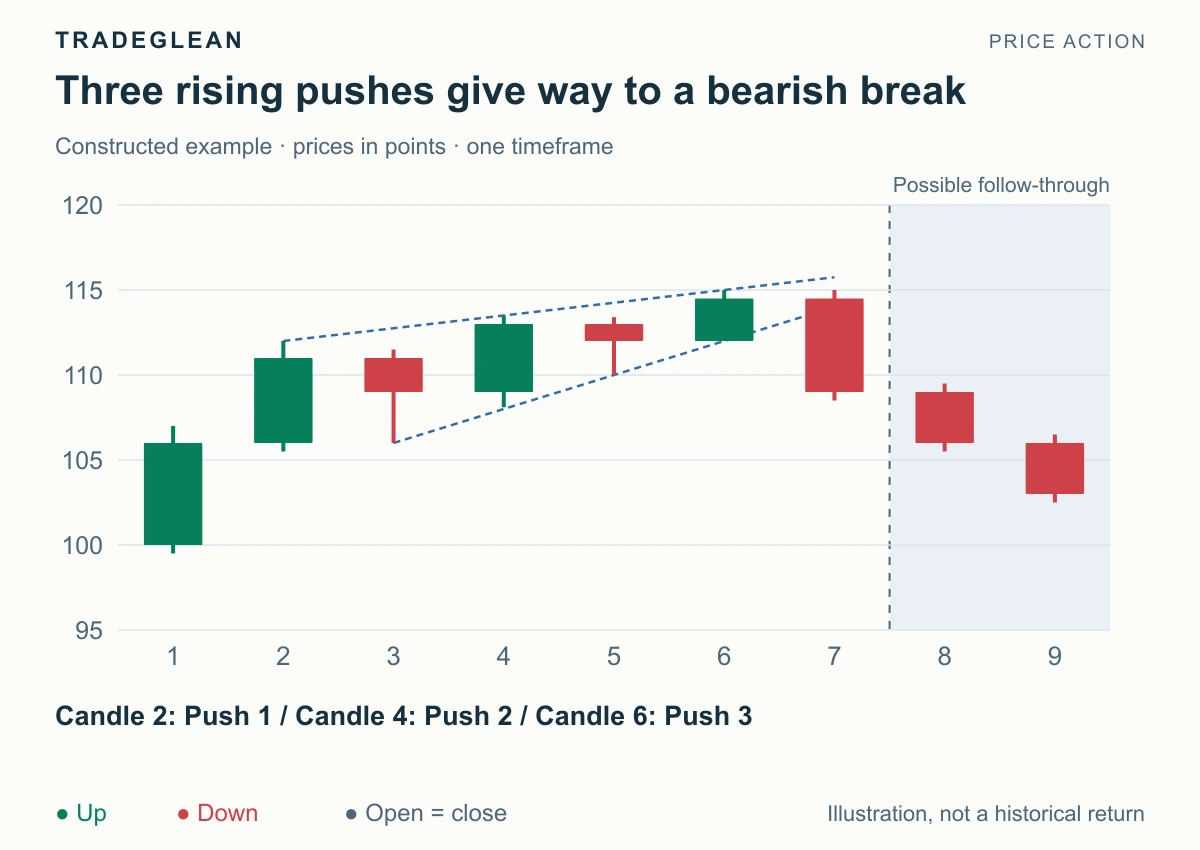
Constructed schematic. Candles 8–9 show subsequent movement after the reversal trigger.
The upward pushes reach 112, 113.5, and 115 on candles 2, 4, and 6. The intervening pullback lows rise from 106 to 110.
The lower support line therefore climbs more steeply than the upper resistance line. Buyers keep making new highs, but the area between the two boundaries contracts.
At candle 7, the projected lower boundary is 114. The candle closes at 109, below that line and below the most recent pullback low of 110. This supplies a bearish reversal trigger. Candles 8–9 close at 106 and 103, adding downward follow-through.
The third high at 115 alone was a warning to watch. The later support break changes the directional evidence.
A falling wedge gives the bullish mirror
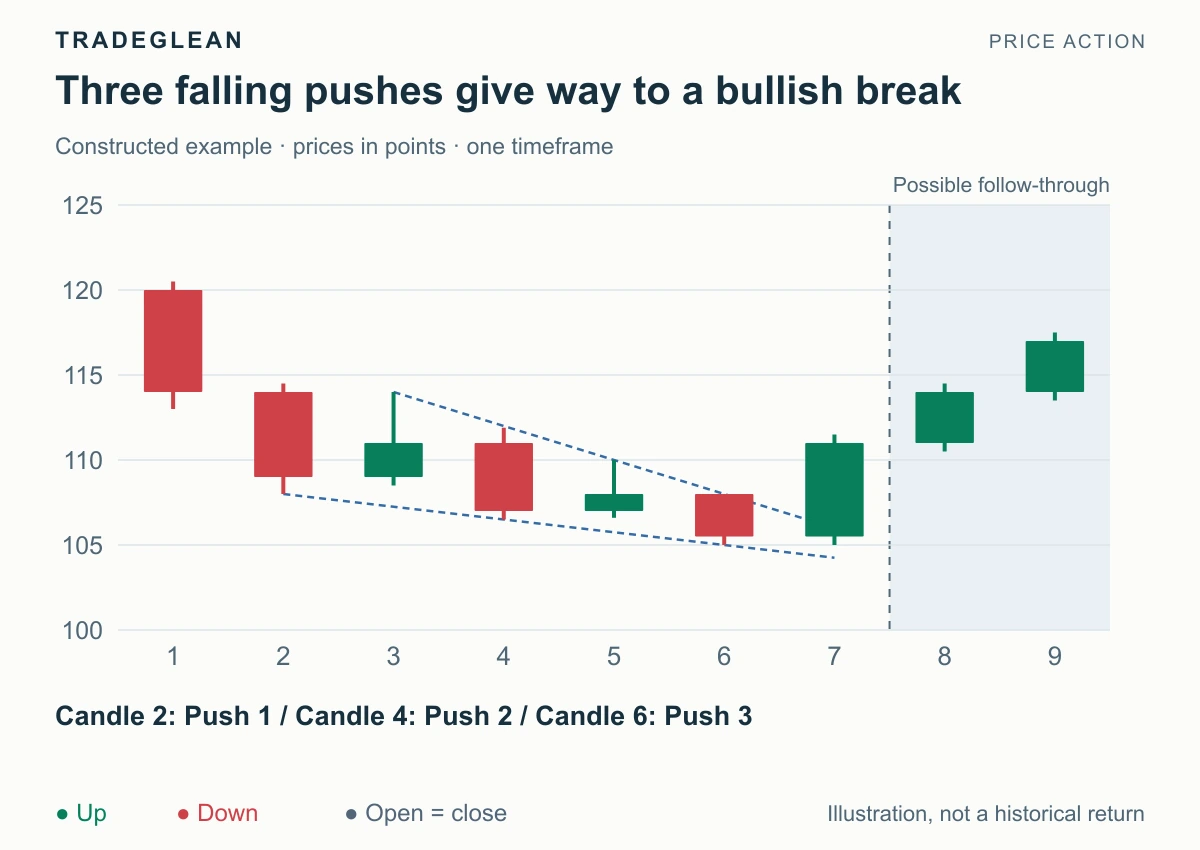
The successive lows are 108, 106.5, and 105. The rebound highs between the pushes fall from 114 to 110, narrowing the downward structure.
At candle 7, the upper boundary is 106. The close at 111 breaks above it and above the latest rebound high of 110. Candles 8–9 then close at 114 and 117.
The resulting reading is bullish. The explanation is a weakening downward sequence followed by an upward structural break, rather than a claim that the third low must be the absolute bottom.
Place the pattern in the surrounding trend
A rising wedge after an extended advance can be a bearish reversal of that advance. A rising wedge forming as a rebound inside a larger downtrend can support bearish continuation of the larger move.
Similarly, a falling wedge can precede an upward reversal of a decline or an upward continuation after a correction within a larger uptrend.
Name both scales when needed. “Bearish break of the rising rebound wedge within the larger downtrend” identifies what is reversing and what is continuing. The broad trend reversal guide explains that distinction.
An upward escape cancels the bearish wedge setup
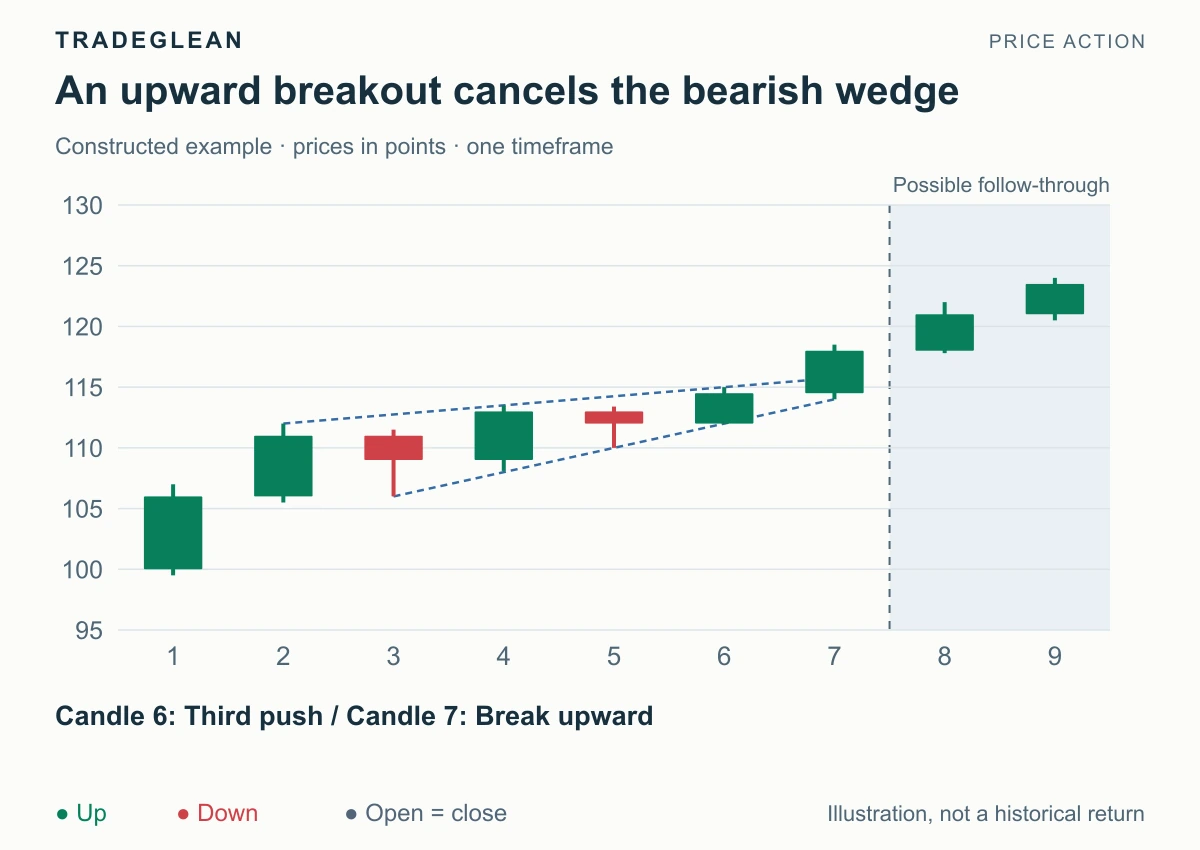
The first six candles are the same as in the bearish example. This time candle 7 closes at 118, above the upper boundary of approximately 115.75. The next closes are 121 and 123.5.
The anticipated bearish reversal did not occur. The upward breakout is succeeding in the displayed sequence. Calling this a “failed breakout” would reverse the meaning: it is the bearish reversal expectation that failed.
For an already triggered bearish setup, renewed acceptance above the wedge's upper extreme would also contradict the premise. Avoid repeatedly redrawing a wider wedge merely to preserve the original opinion.
Further reading
StockCharts describes the classical Rising Wedge and Falling Wedge. These compact examples focus on price geometry and confirmation; they do not establish duration, volume behavior, or a fixed success probability.