Double Tops and Bottoms: Identify the Test and Neckline
Recognize double tops and double bottoms, distinguish a second test from a completed reversal, and locate the neckline that confirms the direction.
Price Action: Trends, Pullbacks & Reversals
Browse the lessons
Bar relationships and channels
Pullbacks and trend development
- High 1, High 2, Low 1, Low 2: Count Pullback Attempts5 min read
- Simple Pullbacks: Find a Clear Trend Restart5 min read
- First Break vs. Second Break: Trade the Pullback Restart5 min read
- Complex Pullbacks and Two-Legged Corrections5 min read
- Spike-and-Channel and Stair-Step Trends: Read the Progress5 min read
Trading ranges and breakout structures
Reversals and chart patterns
- Major Trend Reversals: Read the Break, Test, and Turn4 min read
- Double Tops and Bottoms: Identify the Test and Neckline4 min read · You are here
- Head and Shoulders: Identify the Shape and Neckline Break4 min read
- Final Flags: Identify the Failed Last Push4 min read
- Wedges and Three Pushes: Identify the Reversal Setup4 min read
- Contracting and Expanding Triangles: Read the Boundaries4 min read
Measuring the next move
A completed double top is a bearish reversal structure; a completed double bottom is bullish. In both cases, price tests an extreme twice and then breaks the intervening swing in the opposite direction.
Two similar peaks or troughs are the beginning of the identification process. The neckline break is what separates a candidate from a completed pattern under the close-based rule used here.
How to recognize the structure
| Feature | Double top | Double bottom |
|---|---|---|
| Background | An advance to reverse | A decline to reverse |
| First extreme | A swing high | A swing low |
| Middle swing | A pullback low | A rebound high |
| Second test | A return near the first high | A return near the first low |
| Neckline | The middle swing low | The middle swing high |
| Completion used here | A close below the neckline | A close above the neckline |
The two tests should occupy a comparable price area. They do not need identical prices, equal candle counts, or the same body colors. There must, however, be a meaningful intervening swing. Two neighboring candle highs with almost no retreat between them may simply be a brief pause at resistance.
These are compact price-structure examples. Classical chart analysis may also apply duration and volume criteria; a small pattern on a short chart does not establish a months-long trend change.
A double top becomes bearish below its neckline
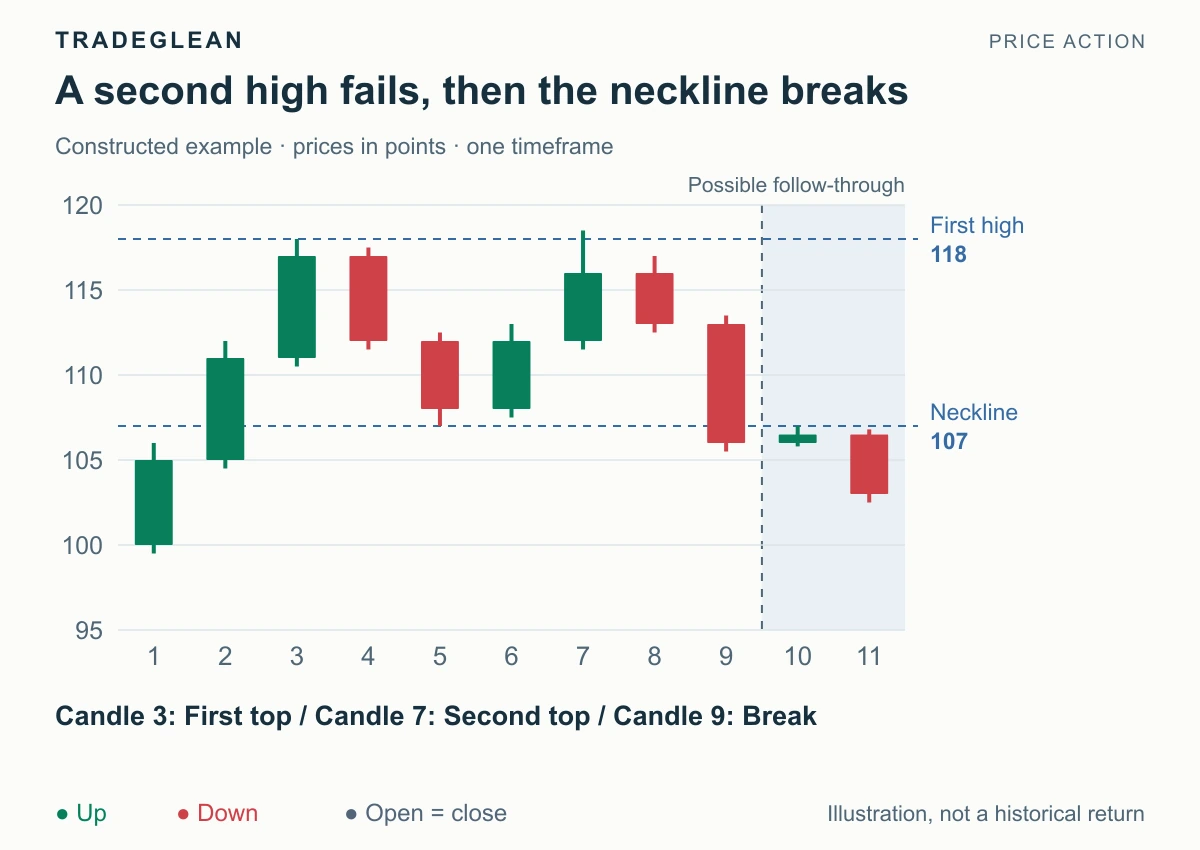
Constructed example with two separated tests, a neckline break, and a subsequent retest.
Candle 3 sets the first high at 118. The retreat reaches 107 on candle 5, establishing the neckline. Candle 7 tests slightly higher at 118.5 but closes at 116, back below the first high.
That failed extension supports the bearish scenario. It does not yet break the neckline. Candle 9 supplies the closing break at 106, beneath 107.
Candle 10 returns to 107 and closes at 106.5. Candle 11 then closes at 103. The old neckline has held as resistance in this particular retest, and the renewed decline supports the bearish reading.
The retest is a possible development, not a required extra step that every completed double top must provide.
A double bottom becomes bullish above its neckline
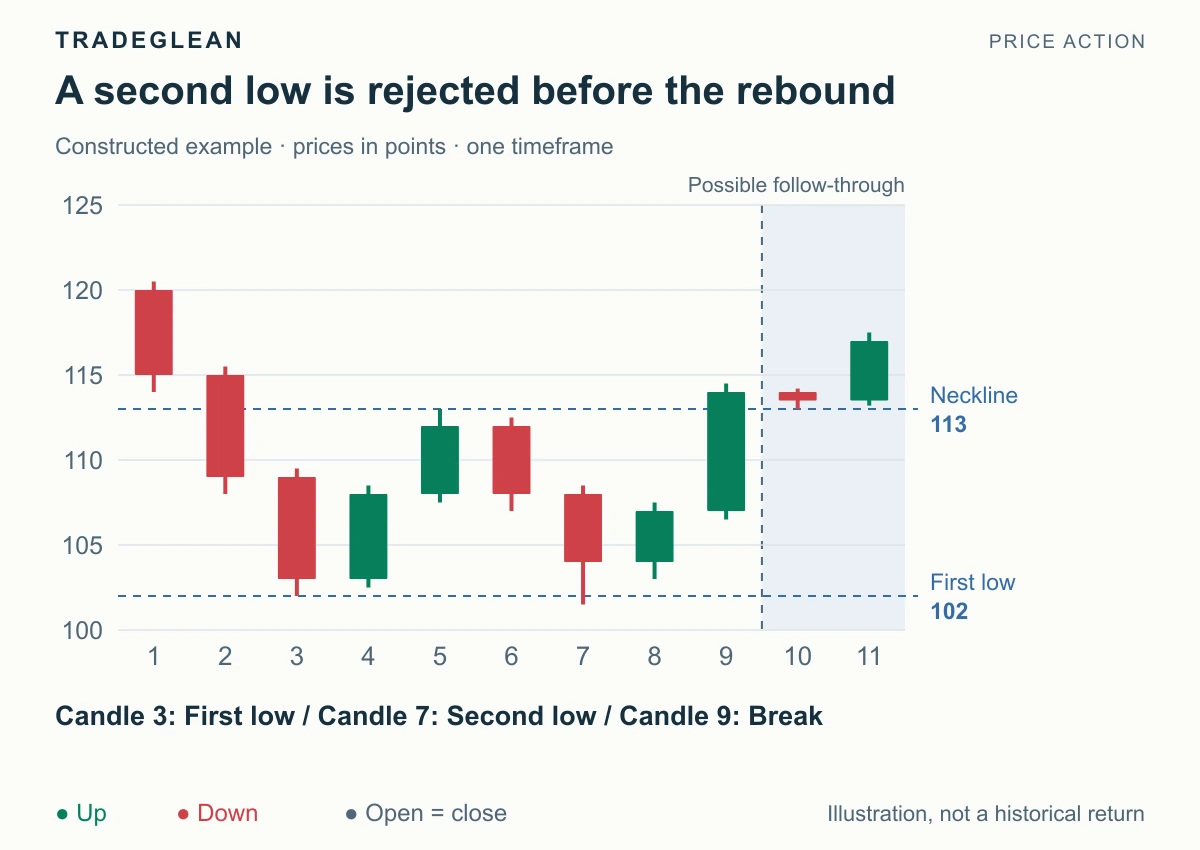
The first low is 102, followed by a rebound to 113. The second test reaches 101.5 but closes at 104, recovering above the first low.
Candle 9 closes at 114, above the 113 neckline. This completes the upward reversal under the stated rule. Candle 10 tests 113 from above, and candle 11 closes at 117.
The bullish conclusion is based on a failed downward extension followed by a break of the intervening rebound high. The color of the lowest candle alone does not establish it.
Separate a 2B-style rejection from neckline completion
A 2B-style test briefly crosses an old extreme and then returns through it. In the double-top example, the second test trades above 118 to 118.5 and closes back below 118.
That is earlier information about rejection at the old high. The later break below 107 is different information about the larger swing structure. An approach acting on the rejection is taking an earlier setup than one waiting for the neckline.
Do not describe those two triggers as if they happened simultaneously. They use different evidence and can fail at different stages. A second test can also stop just short of the original extreme, so a double top does not require a false break above the first high.
Keep broader second tests distinct
A substantially lower second high may fit a bearish major trend reversal without being a clean classical double top. A substantially higher second low may fit the bullish equivalent.
Use the more accurate name rather than stretching “double” to cover any two swings. The practical question remains whether the test fails to restore the old trend and the opposite side then breaks a relevant swing.
After a neckline break, sustained recovery through that neckline weakens the breakout. A move beyond the tested extreme contradicts the completed pattern more decisively: above 118.5 for the illustrated top, or below 101.5 for the illustrated bottom.
Further reading
StockCharts explains the classical versions in Double Top Reversal and Double Bottom Reversal. For the separate task of projecting distance after confirmation, see Measured-Move Targets.