High 1, High 2, Low 1, Low 2: Count Pullback Attempts
Learn to count first and second attempts to resume a trend, distinguish a trigger from a swing high, and reset the count when the pullback ends.
Price Action: Trends, Pullbacks & Reversals
Browse the lessons
Bar relationships and channels
Pullbacks and trend development
- High 1, High 2, Low 1, Low 2: Count Pullback Attempts5 min read · You are here
- Simple Pullbacks: Find a Clear Trend Restart5 min read
- First Break vs. Second Break: Trade the Pullback Restart5 min read
- Complex Pullbacks and Two-Legged Corrections5 min read
- Spike-and-Channel and Stair-Step Trends: Read the Progress5 min read
Trading ranges and breakout structures
Reversals and chart patterns
- Major Trend Reversals: Read the Break, Test, and Turn4 min read
- Double Tops and Bottoms: Identify the Test and Neckline4 min read
- Head and Shoulders: Identify the Shape and Neckline Break4 min read
- Final Flags: Identify the Failed Last Push4 min read
- Wedges and Three Pushes: Identify the Reversal Setup4 min read
- Contracting and Expanding Triangles: Read the Boundaries4 min read
Measuring the next move
Count attempts to resume the trend
H1 and H2 help locate renewed upward attempts during an uptrend's pullback. L1 and L2 locate renewed downward attempts during a downtrend's rebound. The direction comes from that surrounding trend; the count makes the attempted restart easier to describe.
A second attempt can be useful because the first did not sustain the move and the opposing side then had another opportunity. Whether that extra information improves a particular entry depends on its location, close, and available space. The number two is not a success probability.
These labels count price relationships, not winning trades, losing trades, or green candles.
How to identify H1 and H2
Start with a visible upward leg and its sideways or downward pullback. Compare adjacent highs after the pullback has begun.
| Label | Required event |
|---|---|
| H1: High 1 | The first upward attempt whose high exceeds the preceding candle's high |
| Intervening adjustment | A renewed pause or pullback with a lower high after the first attempt |
| H2: High 2 | The next upward attempt whose high exceeds its immediate predecessor's high |
There is no fixed total candle count for the setup. The first attempt may appear after a brief dip or a longer pullback. H2 requires a new adjustment separating the attempts. Successively higher highs during one uninterrupted advance remain one advance.
The signal candle is the completed candle whose high you use as a trigger reference. The H1 or H2 trigger candle is the candle that actually exceeds that high. Marking these as separate roles avoids treating an untriggered signal as an entry.
Read the upward count with actual highs
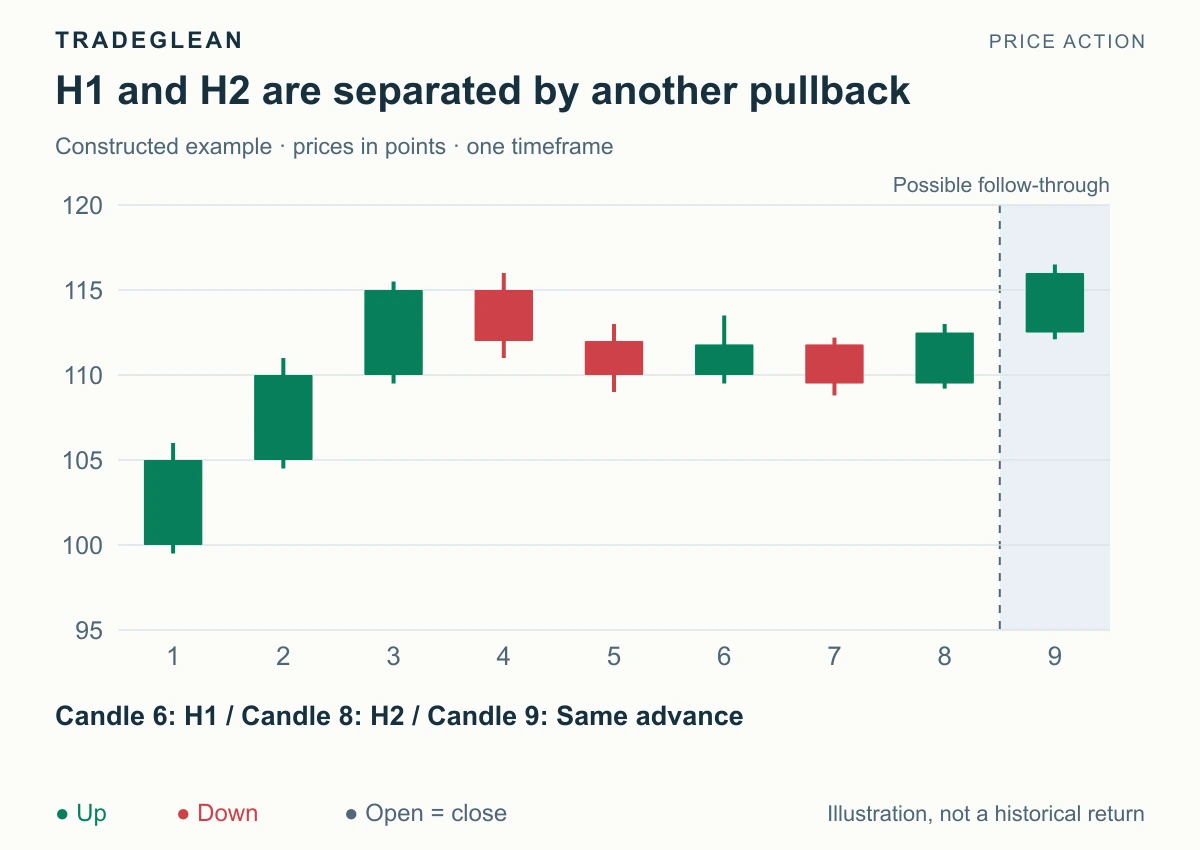
Constructed prices, with green upward closes and red downward closes. The pullback develops from the high at candle 4 through candle 5.
Candle 5 has a high of 113. Candle 6 reaches 113.5, so it is the first renewed upward attempt, H1. Candle 7 then lowers its high to 112.2 and extends the pullback to a low of 108.8.
Candle 8 reaches 113, above candle 7's 112.2. That makes it H2. Its 113 high is lower than H1's 113.5, which is perfectly consistent with the definition: each attempt is compared with its own immediately preceding candle.
The working view is a bullish restart from the pullback. Candle 8 closes at 112.5, above the trigger reference at 112.2. The pullback low at 108.8 is a structural reference, while the earlier high at 116 is the next visible obstacle. Candle 9 then reaches 116.5 and closes at 116, extending the same advance. It is not H3 because no fresh pullback separates it from H2.
Identify L1 and L2 by reversing the comparison
In a downtrend's upward or sideways correction, L1 is the first renewed downward attempt with a low below the preceding candle's low. After another rebound or pause with a higher low, the next qualifying downward attempt is L2.
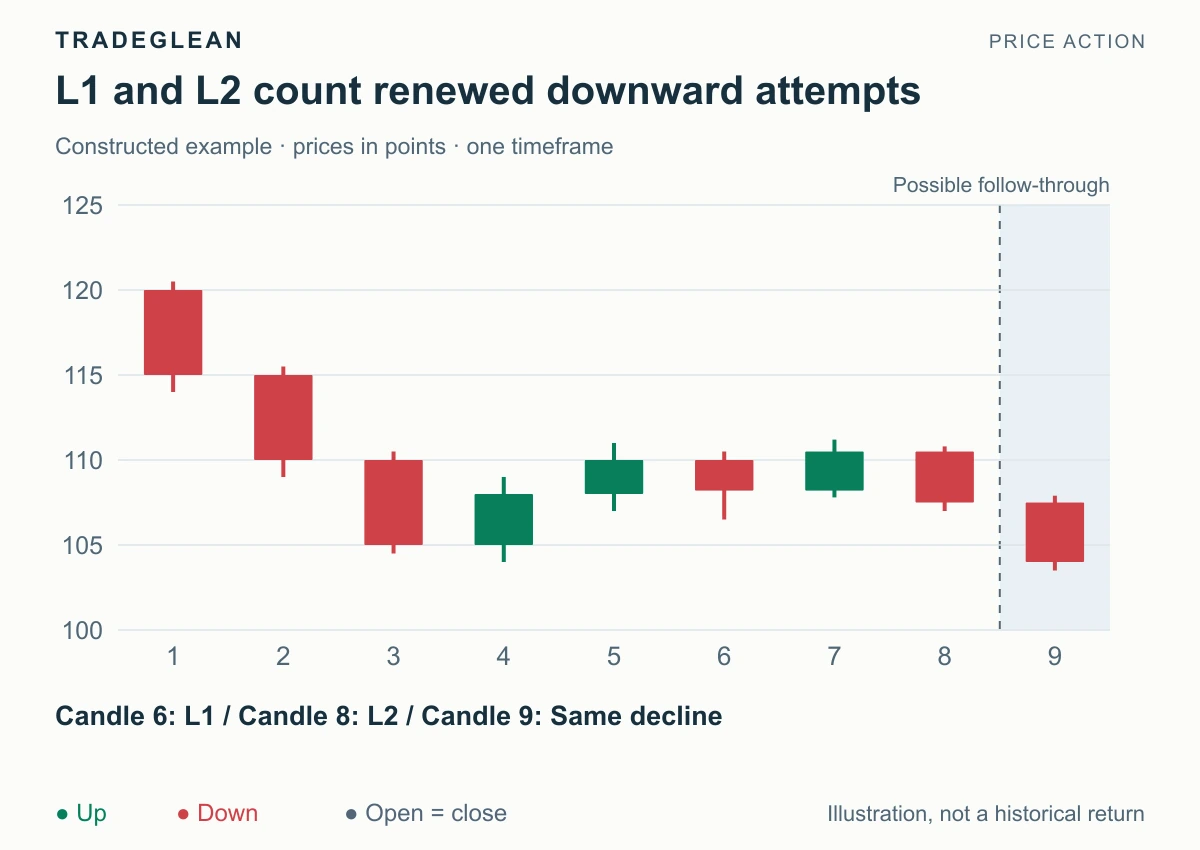
Candle 5's low is 107. Candle 6 trades to 106.5, making L1. Candle 7's low rises to 107.8 during the renewed rebound. Candle 8 then reaches 107, below 107.8, making L2.
Here, L2 is higher than L1 in absolute price, yet it still qualifies. The bearish application is to examine the renewed downward attempt in the existing decline. The rebound high at 111.2 is the visible invalidation reference for a thesis that this correction has ended. Candle 9 subsequently extends down to 103.5.
Neither H nor L requires a particular body color. A candle can exceed the previous high and still close red. The count records that the upward attempt occurred; its weak close may make it an unattractive bullish signal.
Choose a useful location before using the count
A clear pullback into prior support gives a bullish H2 a stronger explanation than an H2 in the middle of an overlapping range. For bearish setups, look for the corresponding rebound into resistance. A second attempt directly beneath nearby resistance may still leave too little room for a long entry.
The count and the trade therefore answer different questions. First verify the adjacent highs or lows. Then inspect the trend, support or resistance, close, protective reference, and next obstacle. The FB and SB guide uses this counting language within more specific first- and second-break setups.
An H2 also does not require that you traded H1. The first attempt can be observed without any position. Likewise, a trader's second loss does not turn the next candle into H2 or L2.
When to stop or restart the count
Once price resumes the trend and clears the old swing extreme, a later pullback begins a new sequence. Reset your analysis if the original supporting structure breaks, a broad range forms, or an opposite trend develops. Do not connect an old H1 to a much later signal across an unrelated consolidation.
An inside bar does not create a strict new higher-high or lower-low trigger. An outside bar crosses both prior extremes, and OHLC alone may not show which crossing came first. Flag that ambiguity instead of inventing an intrabar sequence. The range-relationship guide explains the geometry.
Further reading
The Brooks glossary defines high and low counts. For larger swing structure, see two-legged corrections: two correction legs and two entry attempts are different scales of observation.