Range Breaks: Read the Squeeze Before the Breakout
Identify a range-break squeeze, read rising lows or falling highs near the boundary, and separate the directional setup from a confirmed breakout.
Price Action: Trends, Pullbacks & Reversals
Browse the lessons
Bar relationships and channels
Pullbacks and trend development
- High 1, High 2, Low 1, Low 2: Count Pullback Attempts5 min read
- Simple Pullbacks: Find a Clear Trend Restart5 min read
- First Break vs. Second Break: Trade the Pullback Restart5 min read
- Complex Pullbacks and Two-Legged Corrections5 min read
- Spike-and-Channel and Stair-Step Trends: Read the Progress5 min read
Trading ranges and breakout structures
Reversals and chart patterns
- Major Trend Reversals: Read the Break, Test, and Turn4 min read
- Double Tops and Bottoms: Identify the Test and Neckline4 min read
- Head and Shoulders: Identify the Shape and Neckline Break4 min read
- Final Flags: Identify the Failed Last Push4 min read
- Wedges and Three Pushes: Identify the Reversal Setup4 min read
- Contracting and Expanding Triangles: Read the Boundaries4 min read
Measuring the next move
A range break, or RB, is easier to assess when you can see how price approached the boundary. Repeated shallow retreats beneath resistance support an upward breakout scenario. Repeated weak rebounds above support support a downward scenario. The useful evidence is the shrinking ability to push price away from that edge.
This guide concentrates on that preparation. For the basic definition of a breakout candle and a retest, see Breakout Candles.
How to recognize a range-break squeeze
Start with a visible trading range: price has repeatedly turned near an upper and lower area. Then inspect the activity at the edge being tested.
| Element | Upward setup | Downward setup |
|---|---|---|
| Boundary | Repeated resistance | Repeated support |
| Approach | Pullback lows rise toward resistance | Rebound highs fall toward support |
| Location | Several bars stay near the ceiling | Several bars stay near the floor |
| Trigger used here | A close above the ceiling | A close below the floor |
| Follow-through | Price holds outside and advances | Price holds outside and declines |
A squeeze requires more than two candles of the same color. Identify the boundary first, then show that successive retreats from it are becoming shallower. A fast move across the entire box is a different approach; it has not yet demonstrated an ability to stay near the edge.
The close-based trigger is the rule used in these examples. It avoids treating a momentary wick through resistance as a completed breakout.
Rising lows beneath resistance favor the upward case
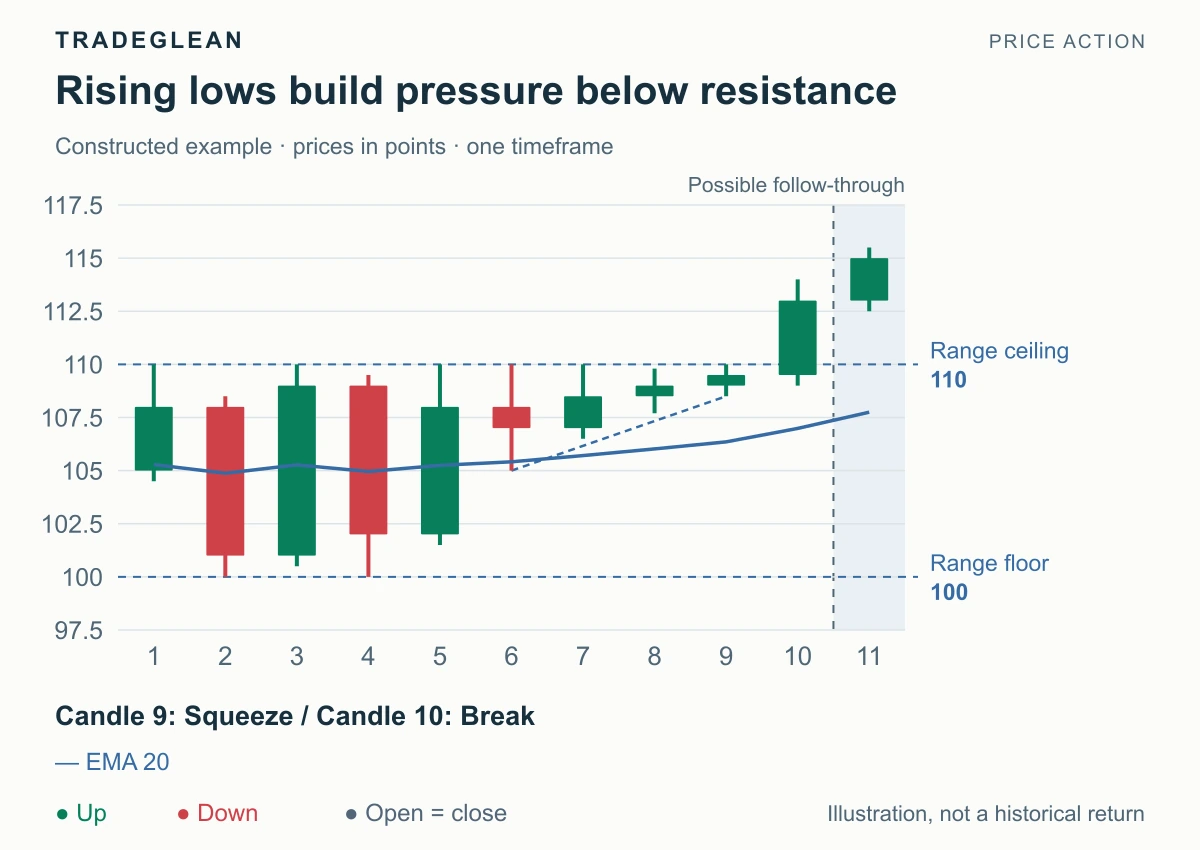
Constructed example with equal candle periods. The last candle illustrates follow-through after the breakout.
Candles 1–5 establish repeated reactions around 100 and 110. Candles 6–9 then stay closer to 110. Their lows rise from 105 to 106.5, 107.7, and 108.5. Sellers still defend the ceiling, but they are no longer taking price back toward the floor.
At candle 9, the preferred scenario is an upward escape if buyers can close above 110. That condition has not happened yet. Candle 10 supplies it by closing at 113. Candle 11 then closes at 115, with its low at 112.5, maintaining separation from the old ceiling.
The distinction matters: the higher lows establish the bias; the close at 113 supplies the trigger; the next candle tests whether the break is gaining acceptance.
Read the moving average as supporting context
The blue line is an EMA20 calculated from the displayed closes and 240 preceding closes of 105. During candles 6–9, its value rises from about 105.42 to 106.35. The gap between the average and the 110 ceiling narrows.
That relationship helps describe the squeeze. The average does not push price through resistance, and a touch of EMA20 is not the trigger. The price structure must stand on its own: known boundary, shallower retreats, and an actual break.
A squeeze can also occur without a useful moving-average relationship. Avoid discarding clear price evidence merely because the average is a little farther away.
Falling highs above support favor the downward case
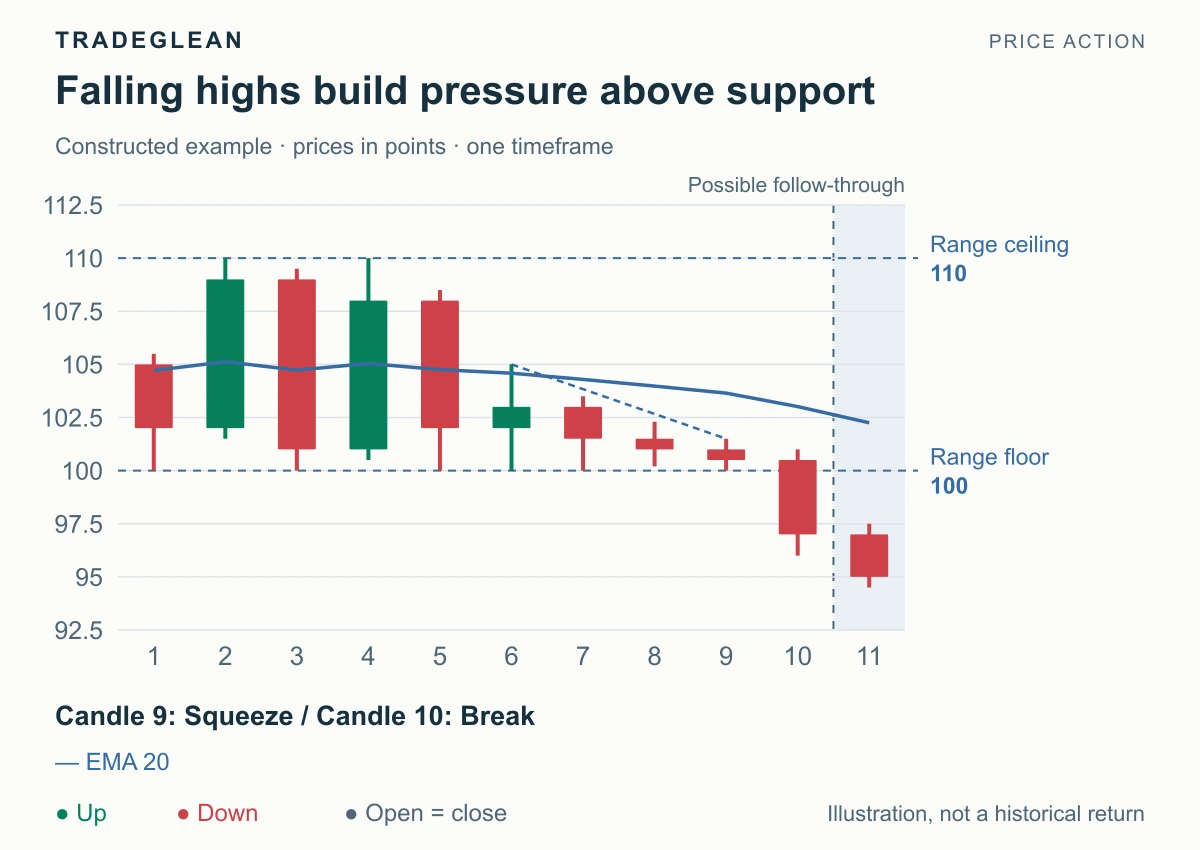
The bearish example uses the same 100–110 range. Candles 6–9 have highs of 105, 103.5, 102.3, and 101.5. Buyers are producing progressively smaller rebounds while sellers keep testing 100.
Candle 10 closes at 97, below support. Candle 11 closes at 95, sustaining the downward move. The bearish reading comes from the lower highs and subsequent close beneath the floor, not from the number of red candles alone.
Recognize when a prepared breakout fails
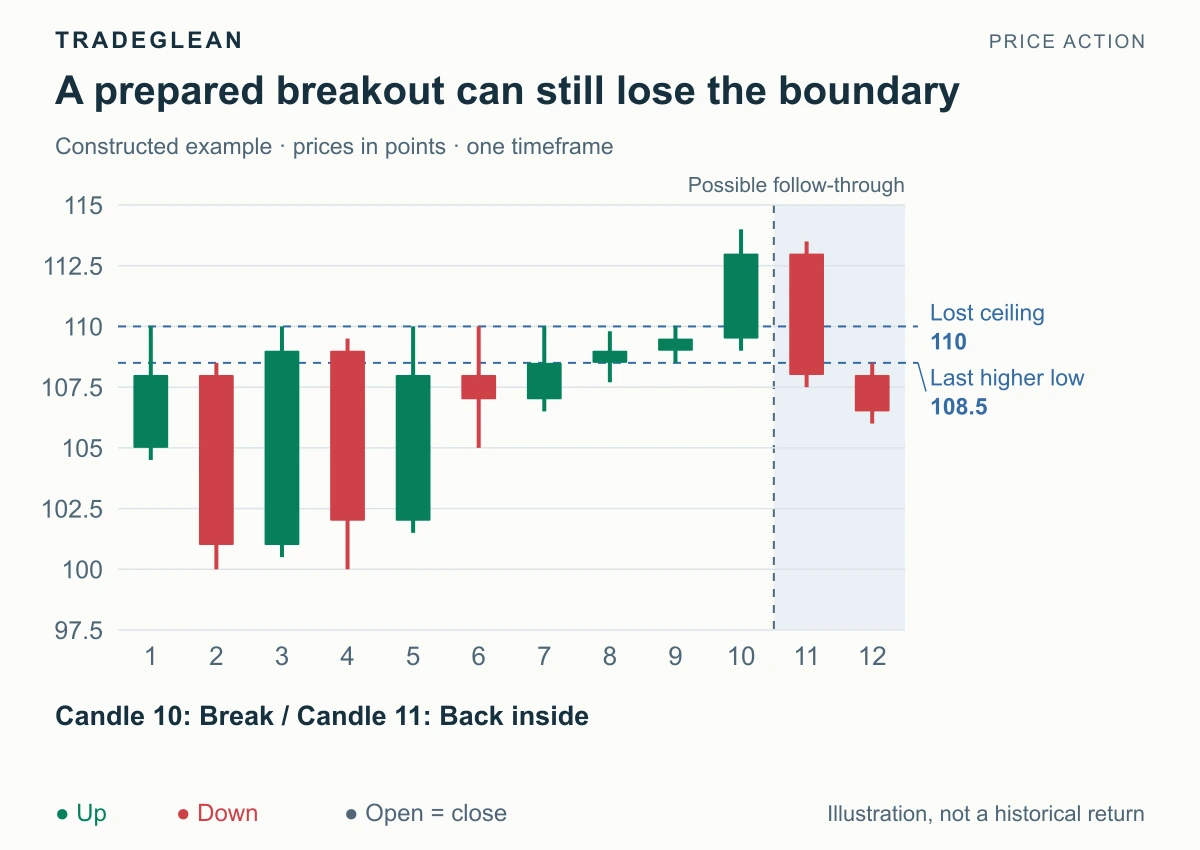
Here the initial squeeze and candle 10 are unchanged. Candle 11 then closes at 108, back below 110 and below the last squeeze low of 108.5. Candle 12 closes at 106.5.
The premise that price would establish itself above the ceiling has failed. A brief touch of 110 would be less damaging; a close back inside followed by further loss of ground is stronger contrary evidence.
Dropping the upward setup does not by itself establish a full downward range break. That would require evidence at the lower boundary. For a rejection that instead travels back through the box, continue with Trading-Range Edges.
Terminology
RB terminology is associated with Bob Volman's Forex Price Action Scalping. This guide uses an explicit close-based example to explain the structure; it does not attach a fixed win rate to the pattern.