Major Trend Reversals: Read the Break, Test, and Turn
Identify a major trend reversal through a broken trend, a test of the old extreme, and renewed opposite movement, with a precise EMA gap-bar definition.
Price Action: Trends, Pullbacks & Reversals
Browse the lessons
Bar relationships and channels
Pullbacks and trend development
- High 1, High 2, Low 1, Low 2: Count Pullback Attempts5 min read
- Simple Pullbacks: Find a Clear Trend Restart5 min read
- First Break vs. Second Break: Trade the Pullback Restart5 min read
- Complex Pullbacks and Two-Legged Corrections5 min read
- Spike-and-Channel and Stair-Step Trends: Read the Progress5 min read
Trading ranges and breakout structures
Reversals and chart patterns
- Major Trend Reversals: Read the Break, Test, and Turn4 min read · You are here
- Double Tops and Bottoms: Identify the Test and Neckline4 min read
- Head and Shoulders: Identify the Shape and Neckline Break4 min read
- Final Flags: Identify the Failed Last Push4 min read
- Wedges and Three Pushes: Identify the Reversal Setup4 min read
- Contracting and Expanding Triangles: Read the Boundaries4 min read
Measuring the next move
A bearish major trend reversal develops when an established uptrend loses its structure, a recovery fails to restore the old advance, and sellers renew the decline. The bullish version starts with a downtrend and reverses those steps.
This is a sequence across swings. A single rejection candle can help time the turn, but it cannot establish the whole sequence. The “major” label refers to the trend being analyzed on the chosen chart; it does not automatically predict a change in the larger market cycle.
How to identify the reversal sequence
Use four stages to organize the chart:
- Existing trend: identify sustained directional progress and its relevant swing points.
- Countertrend break: price crosses the trend line or otherwise disrupts the old structure with meaningful opposite movement.
- Test: price returns toward the old extreme but does not establish convincing continuation.
- Renewed opposite movement: price turns away from the test and breaks a relevant countertrend swing.
A test need not stop at exactly the old high or low. In a bearish setup, it may form a lower high, a similar high, or a slightly higher high that fails. The test's outcome matters more than exact equality.
A trend-line break alone is an early change. Price can still settle into a range. The later test and renewed move provide the additional evidence needed for a stronger directional conclusion.
Read a bearish reversal with specific prices
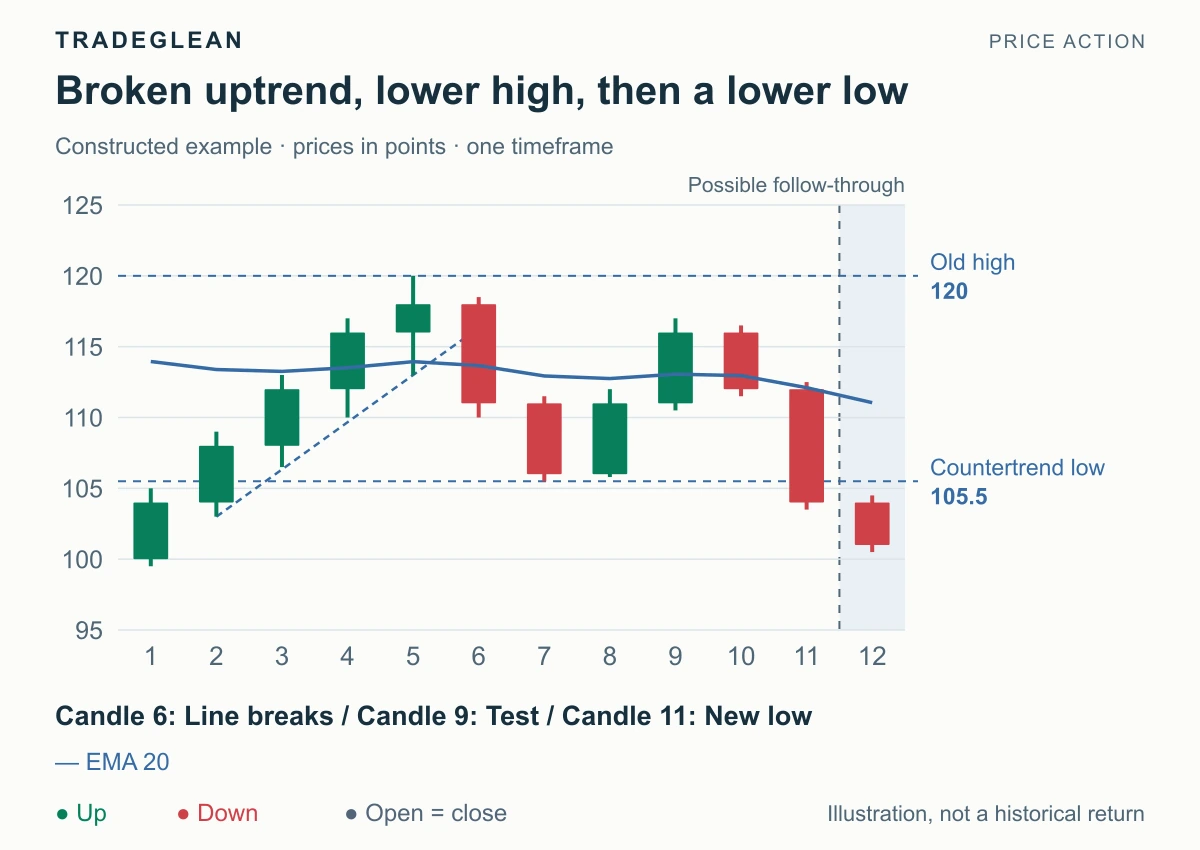
Constructed example. Candle 12 shows subsequent movement after the renewed bearish break. EMA20 uses 240 preceding closes at 115 followed by the displayed closes; the bullish mirror uses preceding closes at 105.
Candles 1–5 advance to a high of 120. Candle 6 breaks the rising support line and closes at 111. Candle 7 extends the decline to a low of 105.5.
The recovery in candles 8–9 reaches only 117, creating a lower high beneath 120. This is the test. It strengthens the bearish case because buyers have not restored the prior extreme.
Candle 10 turns down, and candle 11 closes at 104, below the 105.5 countertrend low. At this point the chart shows a broken uptrend, a lower high, and a renewed lower low. The preferred reading is bearish continuation from the completed reversal sequence. Candle 12 illustrates that continuation with a close at 101.
A move above 117 would challenge the lower-high setup. Sustained recovery above 120 would contradict the broader premise that the old advance had failed. Select the relevant invalidation level for the actual setup rather than using both prices interchangeably.
Define an EMA gap bar correctly
In this context, a moving-average gap bar is a candle whose entire high–low range sits on one side of the average.
| Type | Required comparison |
|---|---|
| Entirely below the average | Candle high is below that candle's EMA value |
| Entirely above the average | Candle low is above that candle's EMA value |
| Not a gap bar | Any part of the range touches or crosses the EMA |
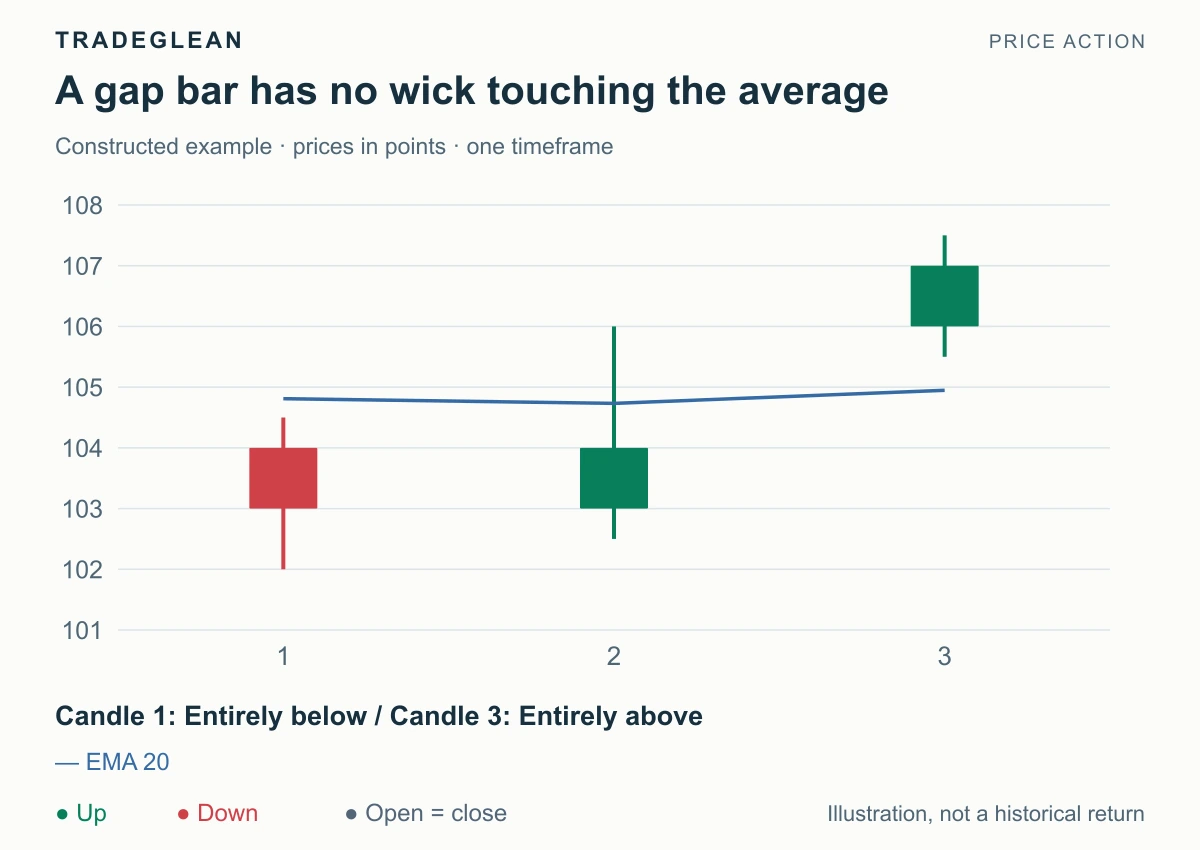
The diagram's EMA20 uses 240 preceding closes at 105. For candle 1, the high is 104.5, below EMA20 at about 104.81. Candle 2 closes below the average but its high reaches 106, crossing the line; it is not a gap bar. Candle 3 has a low of 105.5, above EMA20 at about 104.95.
This is separation from an average, not a price gap between consecutive candles.
In the bearish reversal chart, candle 7's high of 111.5 sits below EMA20 at about 112.93. That supports the evidence of countertrend strength after the advance. It does not replace the later test and renewed decline.
Apply the bullish mirror
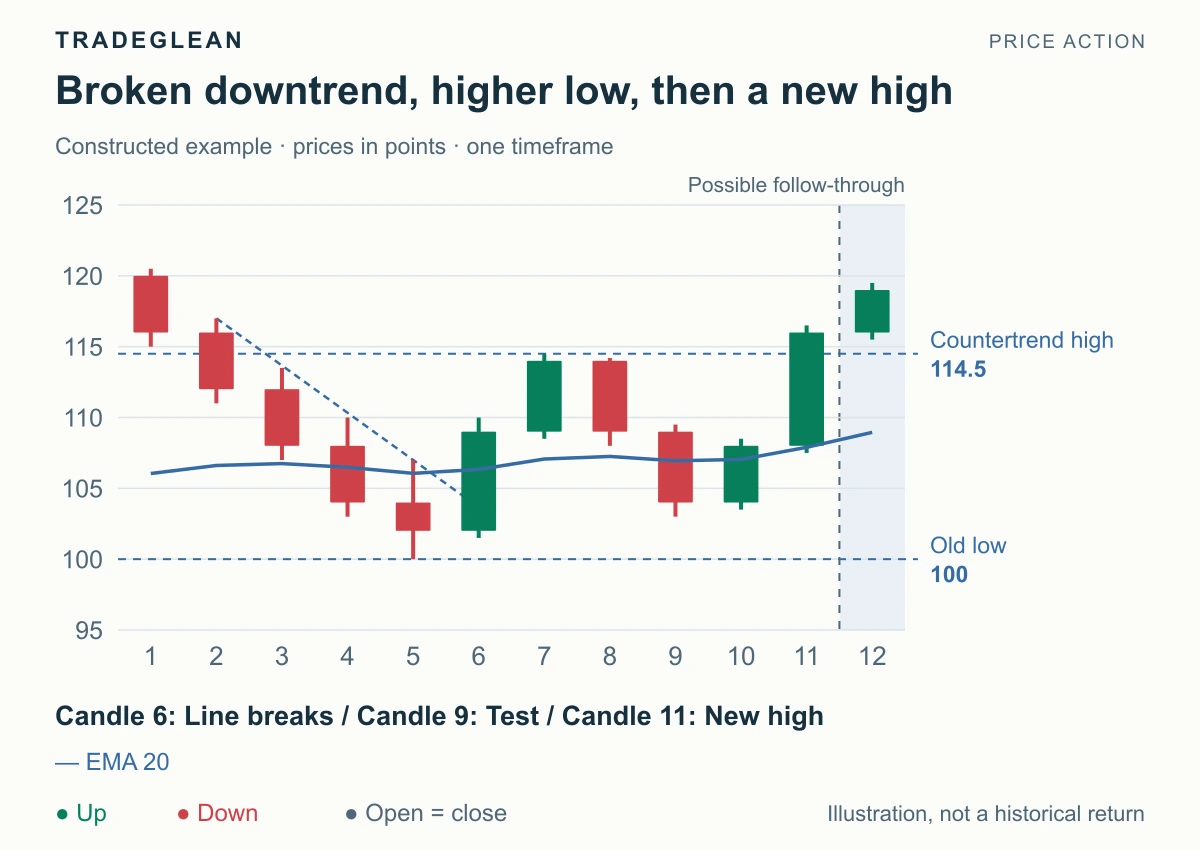
The old low is 100. An upward break produces a countertrend high of 114.5. The subsequent test holds at 103, a higher low, and candle 11 closes at 116, above 114.5.
The completed sequence favors further upward movement. Losing 103 would challenge the higher-low setup; returning below 100 would undermine the broader reversal reading.
For more detailed two-test structures, continue with Double Tops and Double Bottoms.
Further reading
Al Brooks describes major trend reversals and moving-average gap bars in his trading terms glossary and price-action pattern overview. The examples here state their own price levels and do not assume a universal success rate.