ii, iii, and IOI Patterns: Recognize Candle Compression
Count nested inside bars and inside-outside-inside sequences, mark their inner and outer boundaries, and connect a breakout to the surrounding trend.
Price Action: Trends, Pullbacks & Reversals
Browse the lessons
Bar relationships and channels
Pullbacks and trend development
- High 1, High 2, Low 1, Low 2: Count Pullback Attempts5 min read
- Simple Pullbacks: Find a Clear Trend Restart5 min read
- First Break vs. Second Break: Trade the Pullback Restart5 min read
- Complex Pullbacks and Two-Legged Corrections5 min read
- Spike-and-Channel and Stair-Step Trends: Read the Progress5 min read
Trading ranges and breakout structures
Reversals and chart patterns
- Major Trend Reversals: Read the Break, Test, and Turn4 min read
- Double Tops and Bottoms: Identify the Test and Neckline4 min read
- Head and Shoulders: Identify the Shape and Neckline Break4 min read
- Final Flags: Identify the Failed Last Push4 min read
- Wedges and Three Pushes: Identify the Reversal Setup4 min read
- Contracting and Expanding Triangles: Read the Boundaries4 min read
Measuring the next move
Compression gives you boundaries to watch
When a clear trend pauses in a compact cluster, favor a breakout back in the trend's direction. The ii, iii, and IOI labels help define that cluster precisely. They do not replace the trend or turn a sideways market into a bullish one.
These structures become useful when you can answer three questions: which candles belong to the pattern, which boundary supplies the trigger, and which larger boundary still lies ahead. An inner break can occur well before price clears the whole structure.
The inside-and-outside-bar guide explains the two-candle comparisons used here. The charts below extend those comparisons across a sequence.
How to identify ii and iii
The letter i means that a candle's full high-to-low range is inside the immediately preceding candle. Count the relationships one at a time.
| Label | Required relationships | Candles needed to display the complete example |
|---|---|---|
| ii | Two consecutive inside bars | A reference mother plus two inside bars: three candles |
| iii | Three consecutive inside bars | A reference mother plus three inside bars: four candles |
Each new inside bar must stay within its immediate predecessor, with at least one edge moving inward under this guide's convention. A cluster remaining inside one large candle does not automatically satisfy that stricter nested pattern.
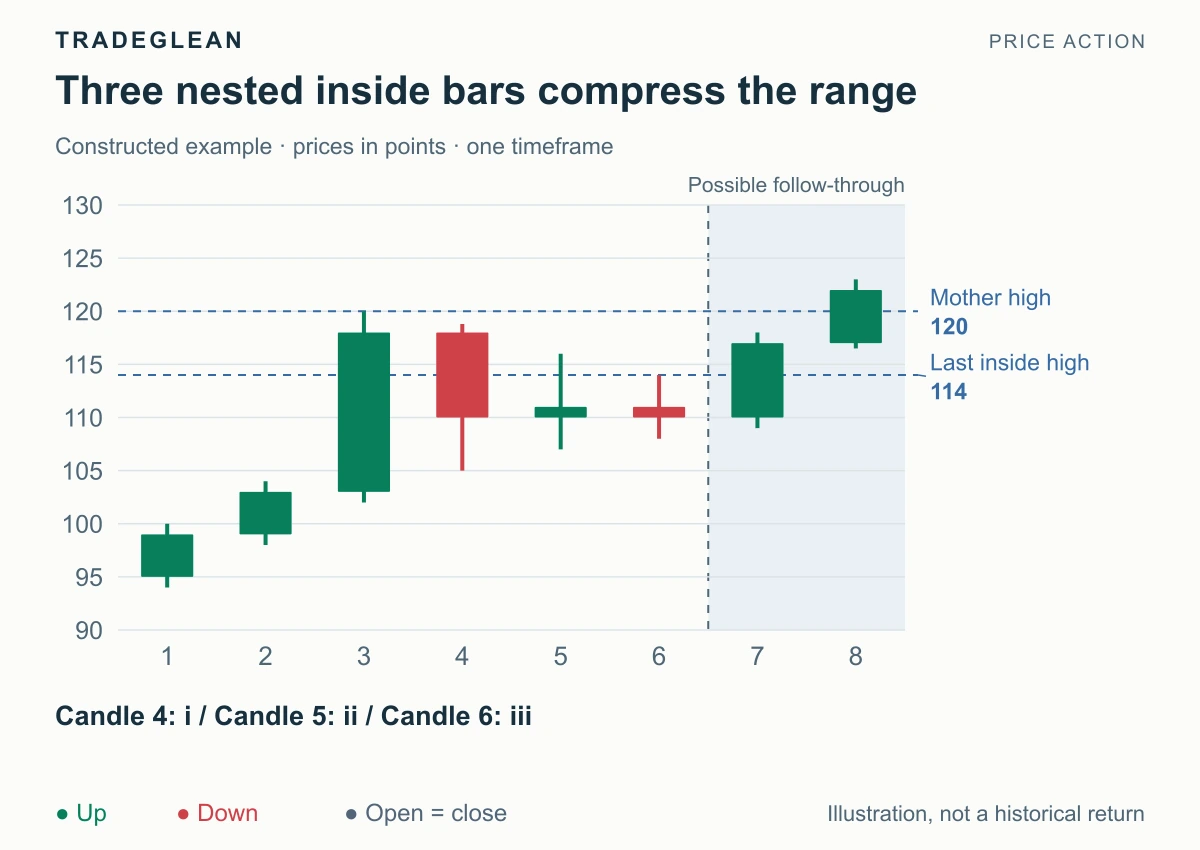
Constructed prices. Green closes above open; red closes below. Candles 4–6 are the three inside bars.
Candle 3 is the mother, spanning 102–120. Candle 4 contracts to 105–118.8, candle 5 to 107–116, and candle 6 to 108–114. Every comparison is contained within the one immediately before it. By candle 6, the complete iii is visible.
The advance on the left supports a bullish continuation view. The last inside high is 114, while the mother high remains 120. Candle 7 closes at 117: the inner break has happened, but the outer high has not yet cleared. Candle 8 then closes at 122 and clears the mother high.
That distinction affects application. An early trigger around the inner high faces 120 as the next obstacle. Waiting beyond 120 supplies more evidence of escape but changes the entry distance and the protective reference. Do not describe candle 7 as already having broken the entire mother range.
How to identify IOI
IOI means inside, outside, inside, in that order. The three named candles need one earlier reference candle to verify the first inside relationship. A fully inspectable illustration therefore shows at least four candles.
- The first named candle contracts within its predecessor.
- The next candle expands beyond both ends of that inside bar.
- The final candle contracts within the outside bar.
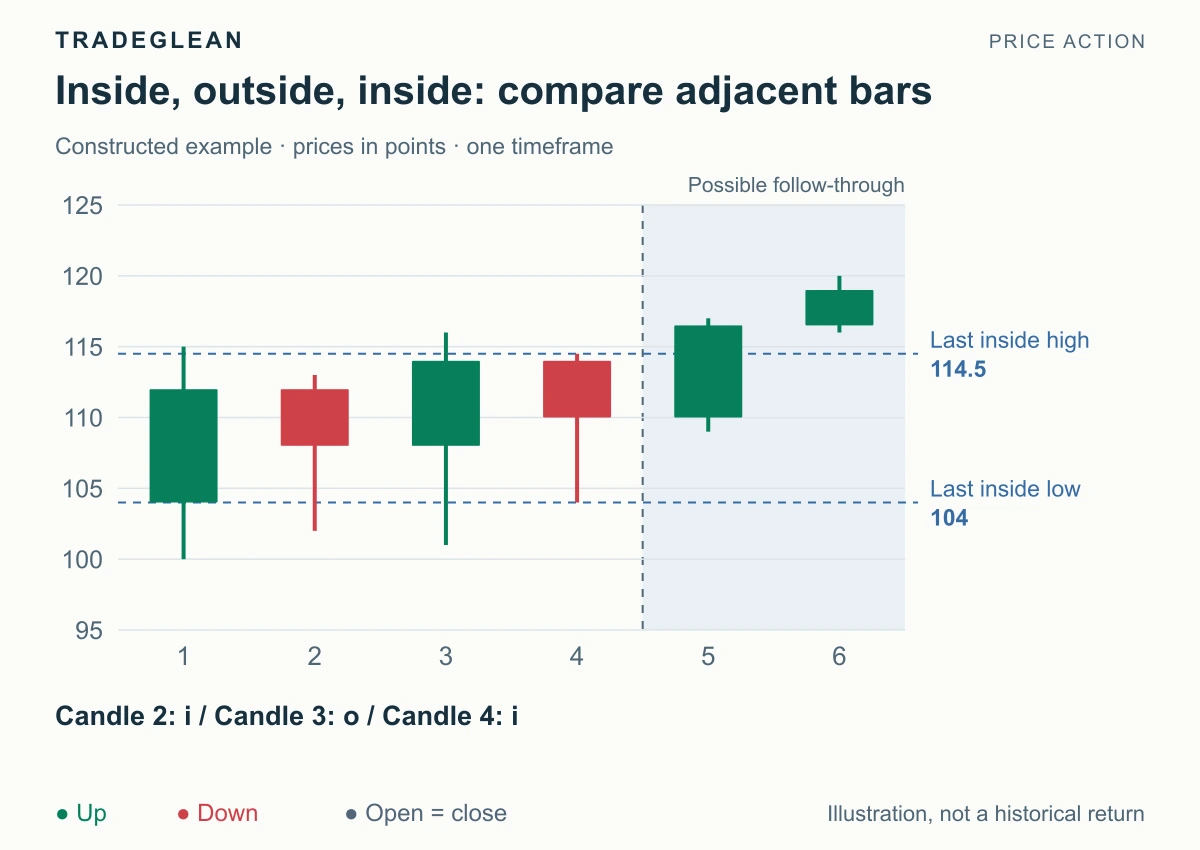
Candle 1 supplies the reference. Candles 2, 3, and 4 form the IOI.
Candle 2 spans 102–113 inside candle 1's 100–115. Candle 3 expands to 101–116, exceeding both ends of candle 2. Candle 4 contracts to 104–114.5 inside candle 3. That is the complete sequence.
The final inside bar supplies the nearby references: 114.5 above and 104 below. Candle 5 closes at 116.5, clearing the final inside high and the outside high at 116. The illustrated resolution is bullish. Without the later candles or a supplied directional background, the IOI alone would describe compression after expansion, not a completed upward signal.
In an uptrend pullback at support, prioritize that upward resolution. In a downtrend rebound at resistance, prioritize a break below the last inside low. This connects the same range structure to a specific trading environment.
The common counting mistake
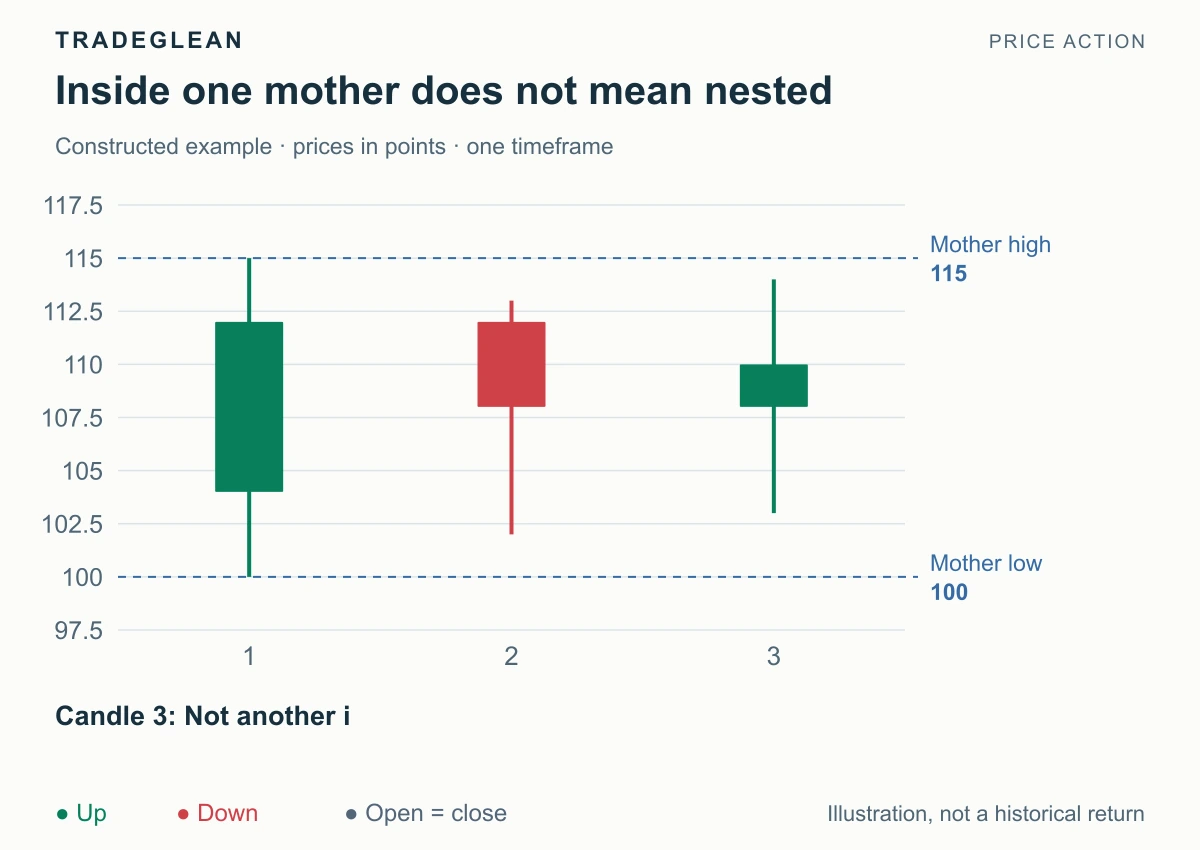
The mother spans 100–115. Candle 2 spans 102–113. Candle 3 stays inside the mother at 103–114, but its high exceeds candle 2's 113. It is therefore not another inside bar. The pair does not make ii under the consecutive-nesting rule.
Write the actual relationship instead of forcing the label. This broader mother-range consolidation may still matter, but its trigger and definition should remain consistent with what is drawn.
Apply the break at the right scale
The smallest inside bar often offers the nearest trigger. It also sits inside larger ranges that may still restrict progress. Mark those ranges before judging the available space. In a large sideways market, a tight iii at the center can lead directly into the next internal obstacle.
Likewise, IOI is not an instruction to chase both sides in succession. Select the direction justified by the surrounding chart. If price breaks that way and then takes out the opposite protective boundary, the original setup has failed. A trade in the other direction requires its own location and trigger.
For a bullish setup defined by the final inside low holding, a break below that low cancels the tight setup. A method using the outside or mother low allows more movement and carries different risk. Use the existing risk-and-entry walkthrough for those calculations rather than silently swapping boundaries after entry.
Further reading
Brooks' glossary describes ii, iii, and IOI terminology. For a larger consolidation that keeps returning to the same prices, move to trading-range edges.