Doji and Spinning Tops: Read the Pause, Then the Break
Use doji and spinning tops to read a pause within a trend, identify reversal warnings at key levels, and follow the break that establishes direction.
Candlestick Reading for Beginners
Browse the lessons
The foundations
Reading a single candle
Reversal combinations
Momentum, continuation & breakouts
- Wick Reclaims: Read Bullish and Bearish Continuation5 min read
- Three-Candle Continuation: Identify the Next Push5 min read
- Three White Soldiers and Black Crows: Read the Direction5 min read
- Rising and Falling Three Methods: Spot Trend Continuation5 min read
- Breakout Candles: Identify Bullish and Bearish Breaks5 min read
A pause takes its direction from the surrounding setup
For a doji or spinning top, start with the existing trend. An orderly pause in an uptrend favors watching for upward continuation; a pause in a downtrend favors watching for downward continuation. At established resistance after a strong rise, the same loss of momentum becomes a bearish warning. At support after a decline, it draws attention to a possible recovery.
The small body alone is an indecision signal. Its practical use is to give you a compact area to watch: mark the pause high and low, choose the direction supported by the surrounding chart, then look for price to leave the pause in that direction.
How to identify doji, spinning tops, and high-wave candles
Each shape uses one completed candle. A strict doji has equal open and close. A spinning top has a small visible body and wicks on both sides. A high-wave candle emphasizes unusually long wicks relative to the body and nearby candles.
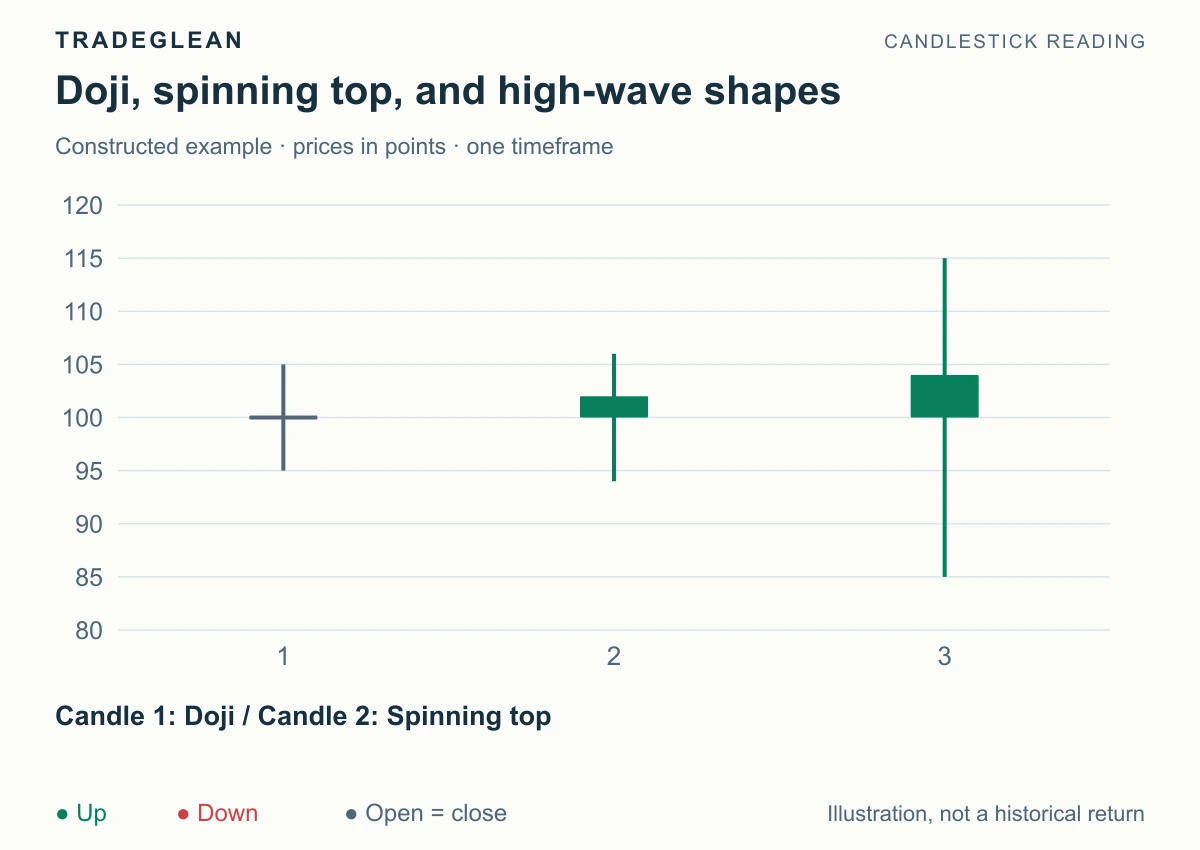
Constructed examples with equal time periods. Green means close above open, red means below, and gray means equal.
| Candle | Open / close | High / low | Body share of range |
|---|---|---|---|
| Doji | 100 / 100 | 105 / 95 | 0% |
| Spinning top | 100 / 102 | 106 / 94 | About 16.7% |
| High-wave example | 100 / 104 | 115 / 85 | About 13.3% |
For a repeatable practice checklist, use a visible spinning-top body no larger than one-third of the range, with each wick longer than the body. This is a working tolerance, not a universal market definition. The illustrated spinning top's 2-point body sits between a 4-point upper wick and a 6-point lower wick. The high-wave candle has a much wider range despite a modest body. These differences matter when you mark an eventual trigger and stop distance.
For near-doji exercises, this article uses a body no larger than 10% of the whole range. That is a stated practice tolerance, not a universal definition. Divide the absolute open-to-close difference by high minus low; do not calculate the fraction if the range is zero.
Follow the upward break in an uptrend
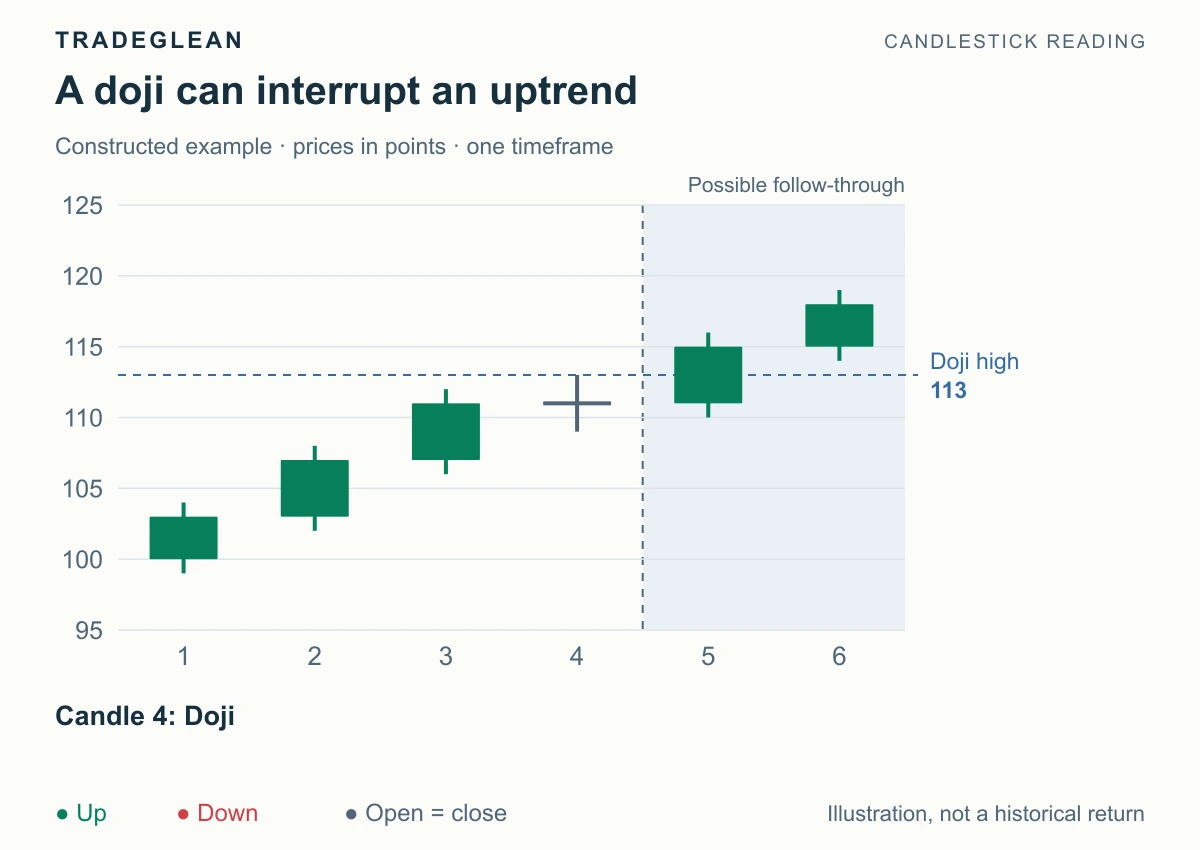
Candle 4 is the pause. Candles 5 and 6 illustrate subsequent upward continuation.
Candle 4 opens and closes at 111, with a high of 113 and a low of 109. The earlier candles have been advancing. With no established resistance shown at the pause, the useful starting view is bullish continuation, pending a break above 113.
Candle 5 closes at 115, completing that directional break. The pause now gives you three practical references: 113 is the level just cleared, 109 is the pause low, and the nearest older resistance on the full chart is the next obstacle to check.
A later pullback holding around the cleared high supports the continuation reading. A close back inside 109–113 weakens follow-through. A break below 109 cancels a plan built on that pause holding.
This is a specific sequence to study: advance, contained hesitation, upward closing break. Selling merely because candle 4 has a tiny body would oppose the trend without a completed reversal.
Apply the downward version to a cluster of doji
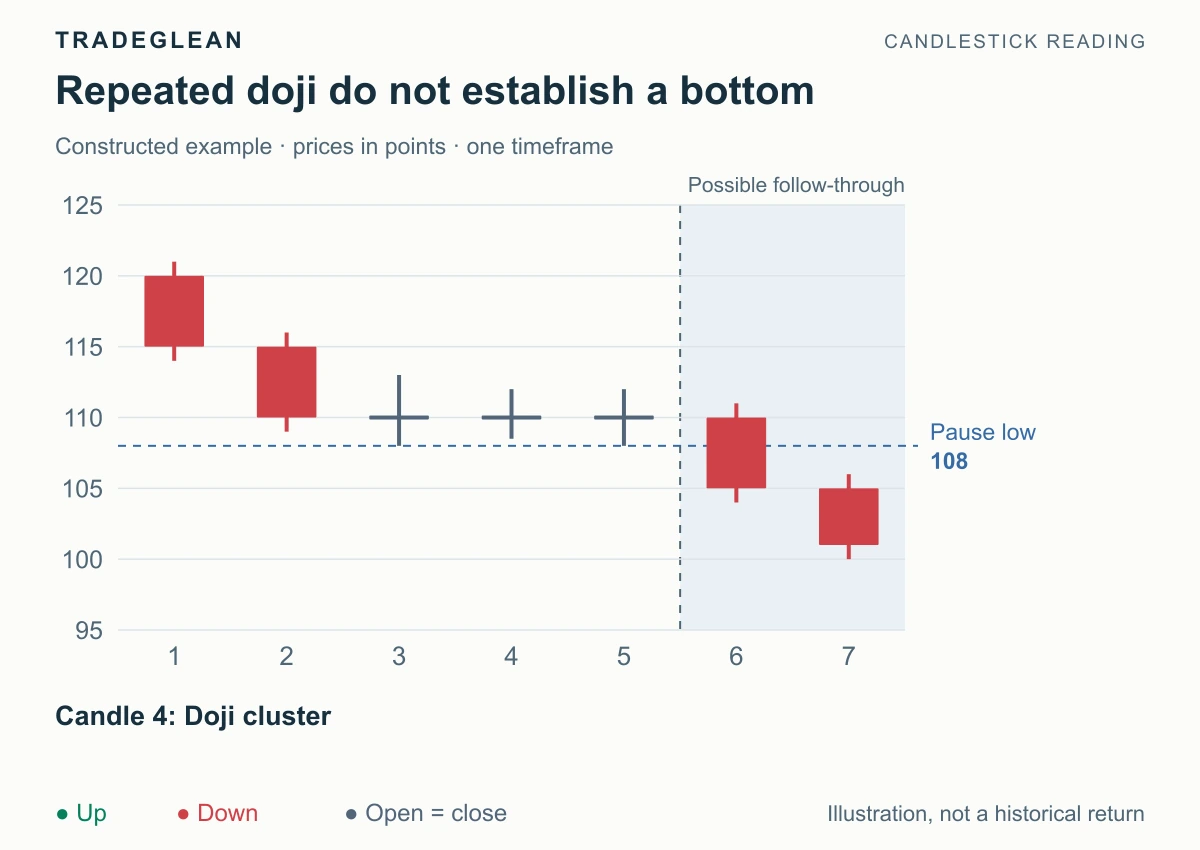
Candles 3–5 form the pause; candle 6 closes at 105 and candle 7 continues lower.
The incoming move is downward, and the three doji do not produce a sustained recovery. Treat them as a pause within that decline. The working view remains bearish, with a close below the cluster low of 108 confirming renewed selling.
A series of small bodies is not, by itself, evidence that buyers have taken control. What matters here is where the whole cluster breaks. Use its combined high and low rather than choosing whichever individual doji gives the tightest-looking boundary.
When the pause becomes a reversal warning
Location can change the setup you prioritize. After a steep advance into a known resistance area, a doji shows that upward progress has stalled where sellers previously responded. The practical bearish trigger is a close below the pause low. After a decline into support, use the mirror: watch for a close above the pause high before treating the recovery as confirmed.
The reason for changing your view is the combination of location, slowing momentum, and the subsequent break. In the middle of an ordinary overlapping range, there may be no worthwhile directional setup yet.
Keep the body and the whole candle separate. A close above a doji's tiny body can still be below its high. For the boundary-break method used here, the full high or low is the reference.
Practice the decision
An uptrend pauses between 109 and 113. No nearby resistance has been identified, and the next candle closes at 115. What is the reading?
Answer: Bullish continuation confirmed by a close above 113. Watch whether the market holds the cleared area; a break of the pause low at 109 cancels the setup. Before planning an entry, check the distance to the nearest resistance and the stop reference.
For small-body candles with one dominant wick, continue to dragonfly and gravestone doji.
References
StockCharts: Introduction to Candlesticks and IG: Candlestick Patterns describe these pause shapes. The boundary-break approach above is an educational framework, not a reported success rate.