Inside and Outside Bars: Read the Full Candle Range
Identify inside and outside bars using complete highs and lows, distinguish them from body engulfing, and use context to choose a directional setup.
Price Action: Trends, Pullbacks & Reversals
Browse the lessons
Bar relationships and channels
Pullbacks and trend development
- High 1, High 2, Low 1, Low 2: Count Pullback Attempts5 min read
- Simple Pullbacks: Find a Clear Trend Restart5 min read
- First Break vs. Second Break: Trade the Pullback Restart5 min read
- Complex Pullbacks and Two-Legged Corrections5 min read
- Spike-and-Channel and Stair-Step Trends: Read the Progress5 min read
Trading ranges and breakout structures
Reversals and chart patterns
- Major Trend Reversals: Read the Break, Test, and Turn4 min read
- Double Tops and Bottoms: Identify the Test and Neckline4 min read
- Head and Shoulders: Identify the Shape and Neckline Break4 min read
- Final Flags: Identify the Failed Last Push4 min read
- Wedges and Three Pushes: Identify the Reversal Setup4 min read
- Contracting and Expanding Triangles: Read the Boundaries4 min read
Measuring the next move
Use the range relationship to sharpen the signal
An inside bar during an orderly trend pullback gives you a compact area from which to watch for continuation. An outside bar that rejects resistance and closes strongly lower supports a bearish reversal reading. Reverse the directions for a downtrend pause or a bullish rejection at support.
The useful first question is what the new candle did with the previous candle's entire range. Did it stay inside, or did it trade beyond both ends? This adds information that body color alone cannot provide.
This guide builds on candle anatomy. All charts use constructed prices, green for an upward close and red for a downward close.
How to identify inside and outside bars
Each comparison uses two adjacent completed candles. Include both wicks when measuring the range.
| Relationship | High comparison | Low comparison |
|---|---|---|
| Inside bar | No higher than the previous high | No lower than the previous low |
| Outside bar | Higher than the previous high | Lower than the previous low |
| Neither | Only one boundary expands, or the comparisons do not fit | Check both ends together |
For inside bars, this guide requires at least one boundary to move inward. Two exactly equal ranges are recorded as equal ranges. For outside bars, both boundaries must expand strictly. Definitions that allow a shared edge exist; these explicit conventions keep the examples consistent.
The larger reference candle before an inside bar is often called its mother bar. An inside bar can be green, red, or a doji. An outside bar can also close in either direction. The range relationship names the structure; the close and location give it a directional use.
Inside bar in an advance: favor the upward continuation
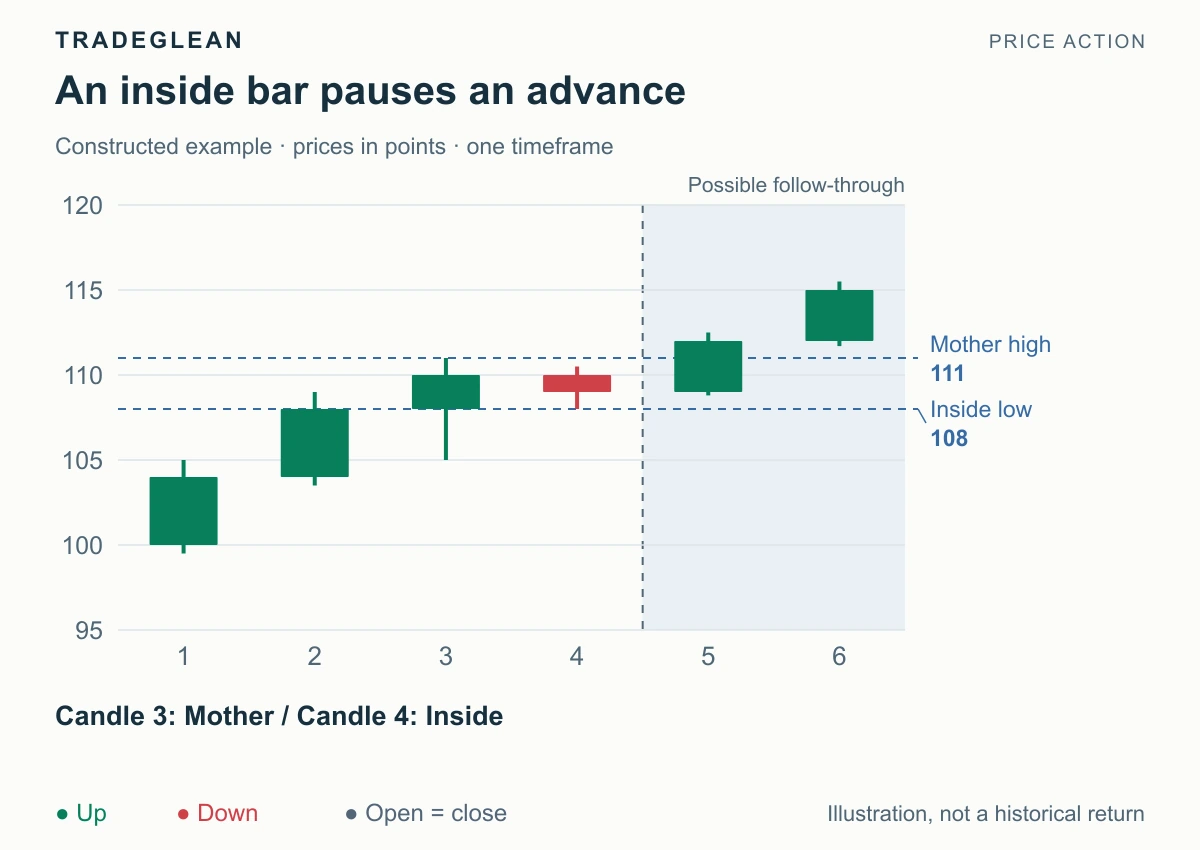
Candle 3 spans 105–111. Candle 4 contracts to 108–110.5. The shaded area shows the subsequent move.
The first three candles advance. Candle 4's high is below 111 and its low is above 105, so it is an inside bar. It pauses the advance without taking back the mother bar's low. The starting view remains bullish.
Two trigger references are available. The inside high at 110.5 gives an earlier boundary; the mother high at 111 requires price to clear the whole comparison. Choose the boundary before the move rather than switching afterward to whichever looks better. In this example, candle 5 closes at 112, above both.
A continuation setup based on the compact pause depends on the inside low at 108 holding. A wider interpretation based on the mother bar uses its 105 low instead. Those are different price risks. Neither boundary should be chosen simply to make a position larger. The planning guide covers the quantity calculation.
An inside bar in a downtrend pullback works in the opposite direction: prioritize a downward break while the surrounding decline remains intact. At a major support or resistance zone, an inside bar can instead participate in a reversal. State that location explicitly; contraction alone does not establish it.
Outside bar at a rally high: read the rejection
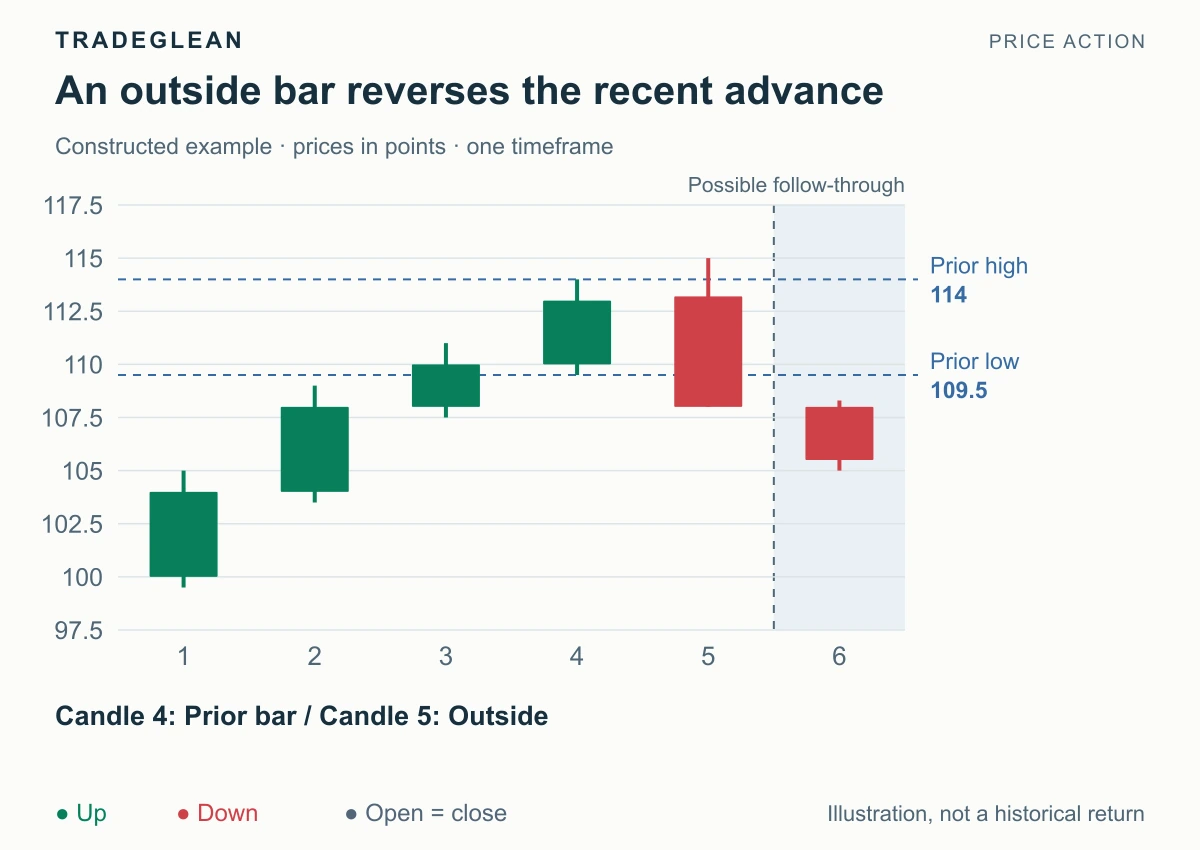
Candle 4 spans 109.5–114; candle 5 spans 108–115 and closes at 108.
Candle 5 trades above the old high, then ends below the old low. Both range boundaries have expanded, and the close leaves the sellers in the stronger position at the end of this candle. After the visible advance, this is a bearish outside-bar rejection. A previously marked resistance zone at the high would add useful context.
The next reference is the outside low at 108. Candle 6 closes at 105.5, giving downward follow-through. A rebound above the rejected 115 high would invalidate a bearish plan built on that rejection.
For a bullish outside bar at support, the mirror is a lower-low excursion followed by a strong close near the upper end. That combination favors recovery. An outside bar closing near its middle gives a much less decisive directional message; do not assign it the strength of the example simply because the range expanded.
Body engulfing is a different test
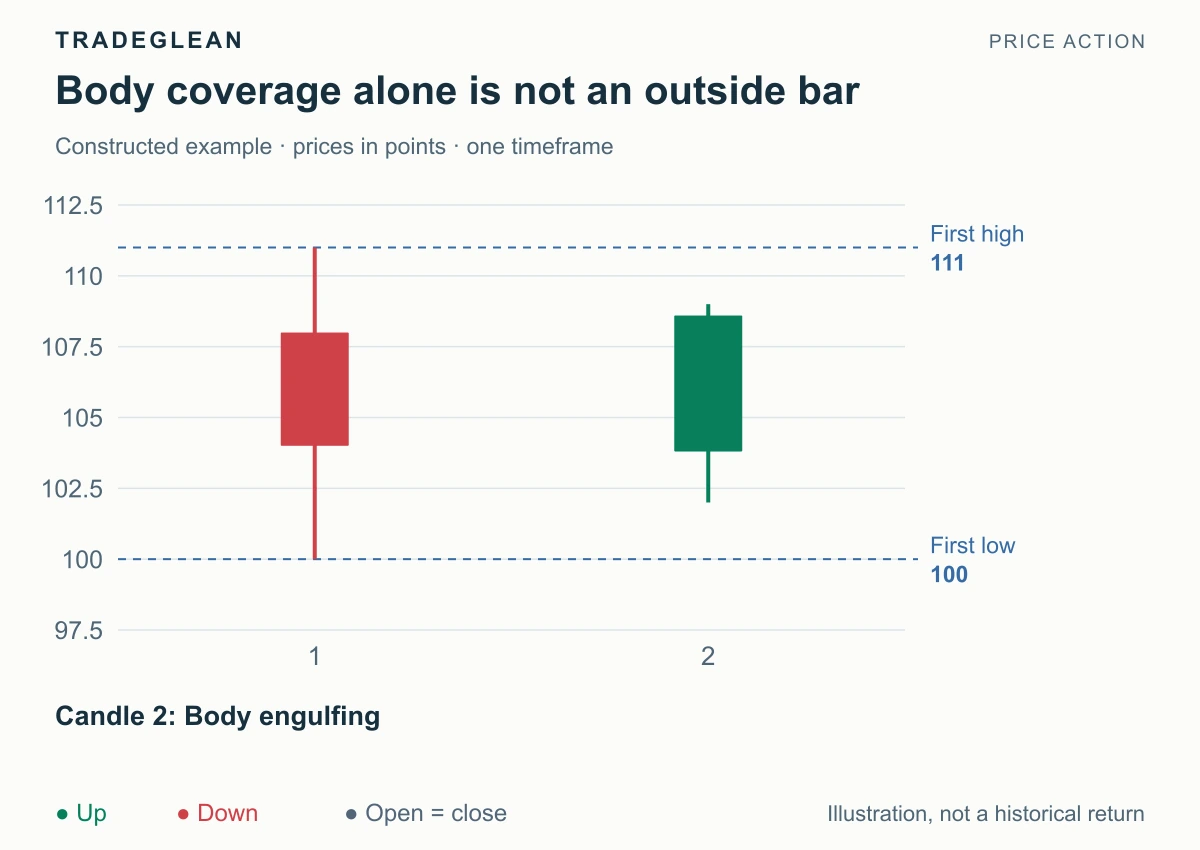
The first body runs from 108 to 104, within a full range of 100–111. The second body runs from 103.8 to 108.6, so it engulfs the first body. Its full range is only 102–109. It does not exceed either earlier wick extreme and is not an outside bar under the definition above.
Use the engulfing-pattern guide for that body-based signal. Keeping the two tests separate prevents a correct observation about the body from turning into an incorrect statement about the entire candle.
When the structure is a poor signal
Repeated overlapping bars near the middle of a range can produce many inside and outside relationships with little net movement. In that setting, the next nearby boundary may consume the available space. Wait for a meaningful location or a clearer structure instead of treating every range change as a fresh directional signal.
An outside bar also cannot reveal the complete order of all intrabar events from OHLC alone. Its closing position is observable; an imagined sequence of traders being trapped is not. Base the explanation on the prices the chart actually records.
Further reading
Brooks' price-action glossary provides terminology for range relationships. Continue with ii, iii, and IOI structures to compare several adjacent ranges.