Trend or Trading Range? Read the Swings Before the Signal
Distinguish directional progress from repeated overlap, recognize a transition, and choose a method that fits the current market structure.
Describe what price is doing across several swings
A trend makes directional progress. A trading range repeatedly moves through an overlapping area. The distinction affects how much continuation a signal can reasonably suggest and where the next obstacle lies.
Read the swings first. One large green candle can be an advance within a downtrend or a bounce inside a range. Its color does not classify the whole market. CME's technical-analysis introduction explains the use of charts to describe trends and price movement.
Use a consistent scale
| Structure | Evidence to look for | What challenges that reading |
|---|---|---|
| Uptrend | Higher swing highs and higher pullback lows | Failure to make progress, then loss of a relevant higher low |
| Downtrend | Lower swing lows and lower rebound highs | Failure to extend lower, then a break of a relevant lower high |
| Range | Repeated upper and lower reactions with substantial overlap | A break followed by acceptance outside the boundaries |
| Transition | Conflicting swings or an incomplete break | More evidence is needed before choosing a directional method |
Use comparable swing points, not every tiny fluctuation. A swing low can only be recognized after price has moved away from it; a drawing with later candles should not make that low appear known in advance.
Follow a trend through its pullbacks
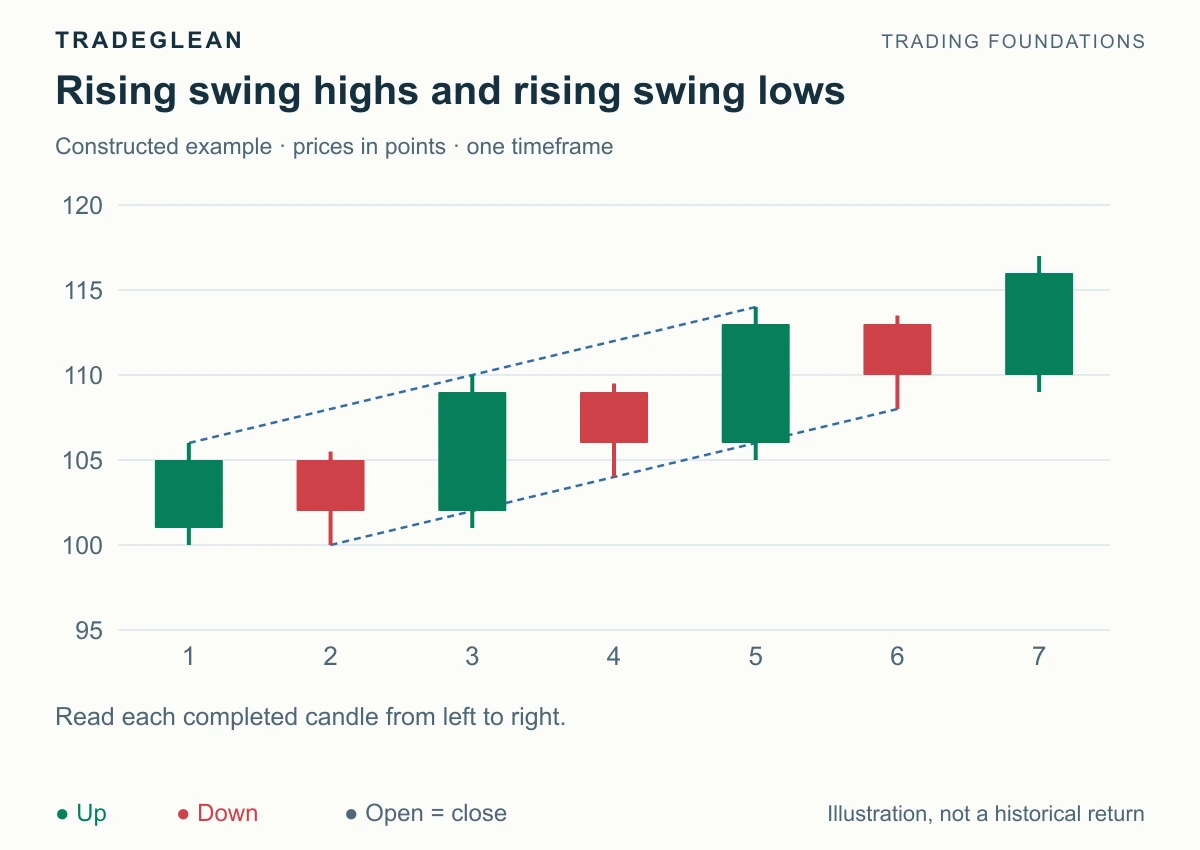
Constructed prices. All candles represent equal intervals; no specific market or success rate is implied.
In this example, swing highs progress from 106 to 110 to 114, while the intervening lows rise from 100 to 104 to 108. The red pullback candles do not erase that overall upward structure.
A simple pullback method would require the correction to remain orderly and an upward trigger to appear. It would not buy solely because price made a higher low. If the market breaks a relevant low, the immediate continuation premise needs reassessment.
Losing one higher low is not, by itself, proof of a lasting downtrend. The market can form a range. The more demanding major-reversal sequence includes a break, a test, and renewed opposite movement.
Recognize repeated movement through the same area
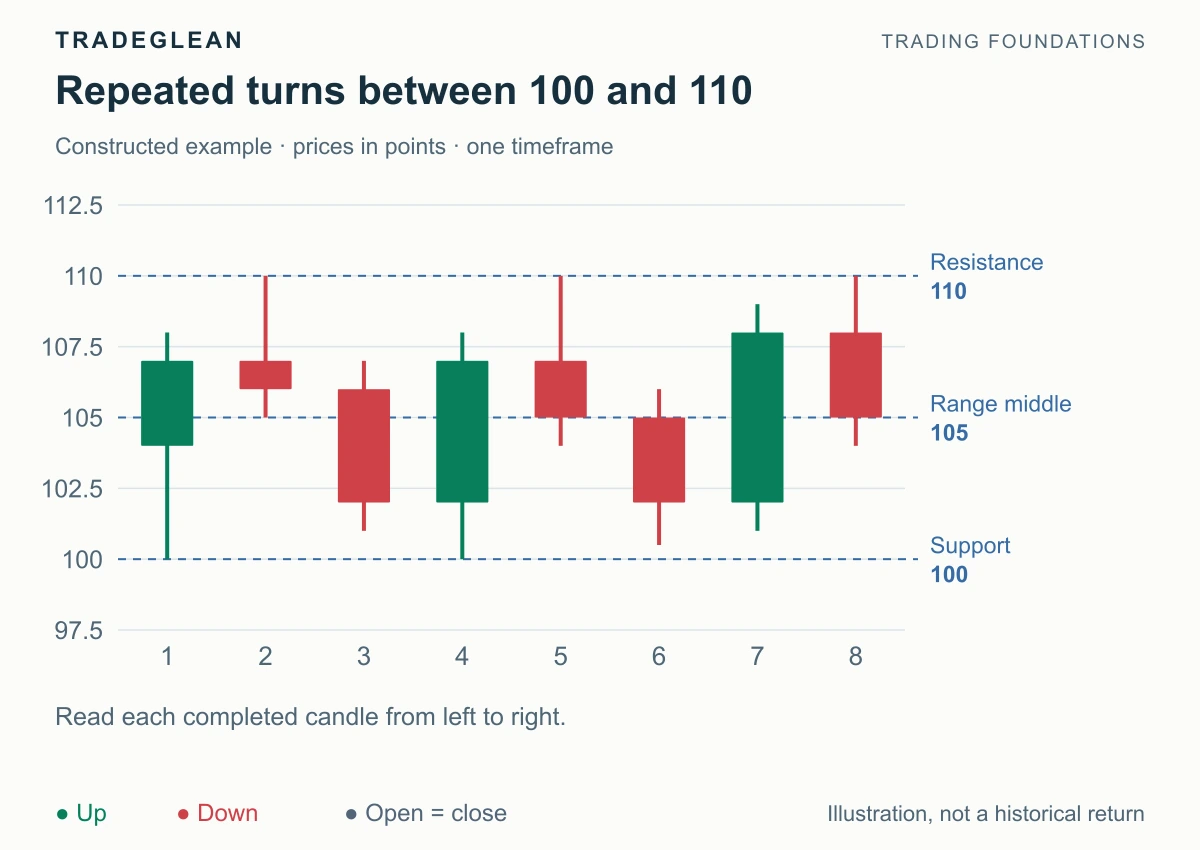
Here, repeated turns near 100 and 110 contain trading. Advances give back ground, and declines recover into the same box. The useful first expectation after a confirmed lower-edge rejection is movement toward an internal obstacle, not an assumed new uptrend.
At 105, the middle of the box, the nearby edges limit the available space in both directions. An impressive candle there may provide a worse location than a clearer response at an edge. See range-edge reversals for the separate trigger and failure conditions.
Allow an uncertain classification
An upward close above 110 is evidence of a break. Continued trading outside or a successful retest adds support. A swift return into the box weakens the breakout, while a stop set for that entry may trigger before the broader interpretation is settled.
If the swings overlap without clear boundaries, label the structure uncertain. Forcing every chart into trend or range can produce arbitrary levels. CME's trend and continuation guide provides additional pattern context, but no shape guarantees continuation.
The same market can rise on one timeframe and pull back on another. Name the timeframe with the conclusion: an hourly uptrend and a five-minute decline can both be accurate. Continue with multiple-timeframe analysis to connect them without changing the rules mid-trade.