Inside Range Breaks: Read Nested Price Structures
Recognize an inside range break, distinguish inner and outer boundaries, and use a shallow handle without mistaking it for a full range breakout.
Price Action: Trends, Pullbacks & Reversals
Browse the lessons
Bar relationships and channels
Pullbacks and trend development
- High 1, High 2, Low 1, Low 2: Count Pullback Attempts5 min read
- Simple Pullbacks: Find a Clear Trend Restart5 min read
- First Break vs. Second Break: Trade the Pullback Restart5 min read
- Complex Pullbacks and Two-Legged Corrections5 min read
- Spike-and-Channel and Stair-Step Trends: Read the Progress5 min read
Trading ranges and breakout structures
Reversals and chart patterns
- Major Trend Reversals: Read the Break, Test, and Turn4 min read
- Double Tops and Bottoms: Identify the Test and Neckline4 min read
- Head and Shoulders: Identify the Shape and Neckline Break4 min read
- Final Flags: Identify the Failed Last Push4 min read
- Wedges and Three Pushes: Identify the Reversal Setup4 min read
- Contracting and Expanding Triangles: Read the Boundaries4 min read
Measuring the next move
An inside range break, or IRB, occurs when a smaller consolidation breaks while price remains inside a larger trading range. In an upward setup, the immediate opportunity is movement toward the larger ceiling. A new trend beyond that ceiling is a later development requiring its own evidence.
The first task is to name the boundary that actually broke. This prevents a small bullish move inside a box from becoming an unsupported claim that the whole market has turned upward.
How to identify the nested structure
An IRB needs two observable structures.
| Part | What to mark |
|---|---|
| Outer range | The larger area with repeated upper and lower reactions |
| Inner range | A smaller group of overlapping bars inside that area |
| Directional preparation | The inner structure's position, recent push, and behavior at its edges |
| Trigger | A break of the inner boundary under your stated rule |
| Next obstacle | The outer edge or another visible level reached first |
The smaller range should have boundaries you can identify before the breakout. One large candle in the middle of the outer box is not enough.
A bullish IRB works toward overhead resistance, so distance matters. If the inner ceiling almost touches the outer ceiling, the same upward signal leaves much less room. Keep that spatial judgment separate from whether the signal is technically present.
Follow the upward example to the correct destination
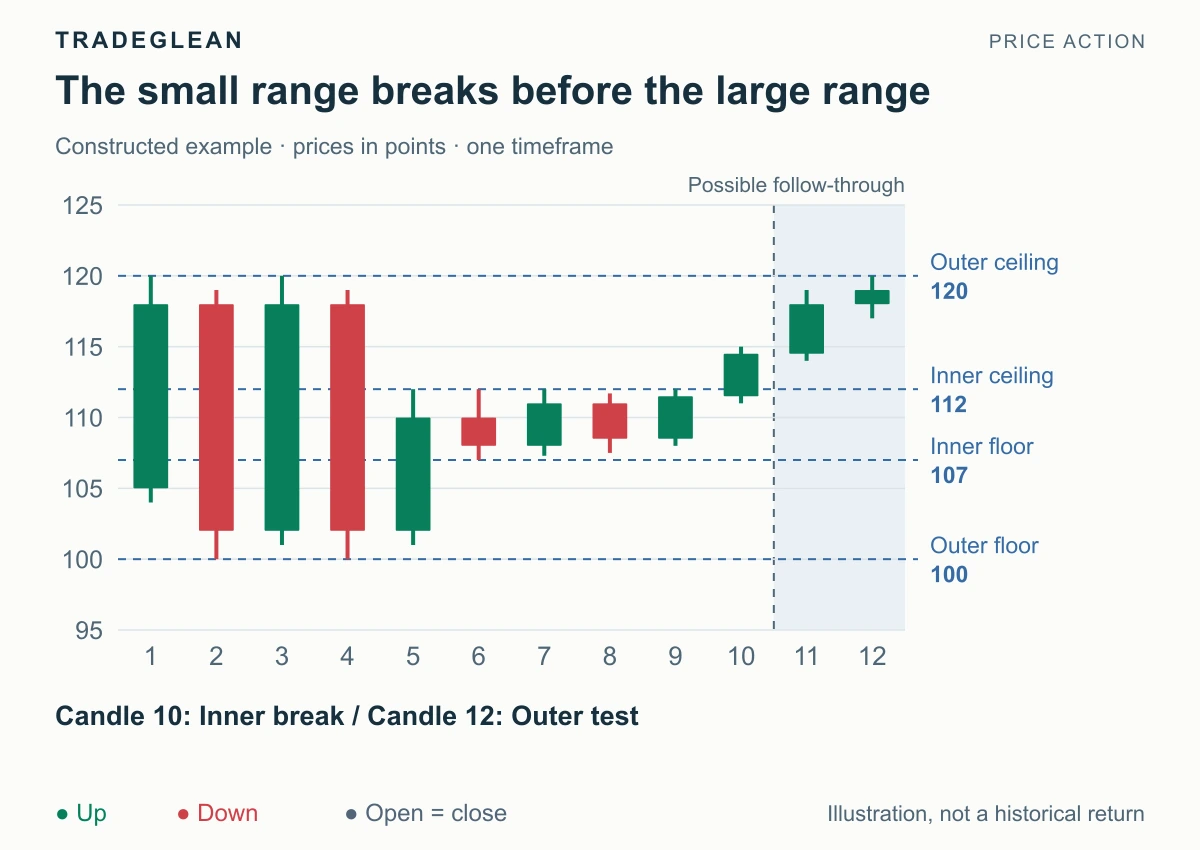
Constructed price example. Later candles illustrate movement toward the outer boundary.
The larger range is 100–120, established by the repeated reactions in candles 1–4. Price then recovers from the floor and forms a smaller range. Candles 6–9 remain between 107 and 112.
The repeated returns toward 112, together with lows rising from 107 to 108, support the upward scenario. Candle 10 closes at 114.5, above the inner ceiling. That is the inner breakout.
Candle 11 closes at 118. Candle 12 reaches 120 but closes at 119. The upward move has reached the larger obstacle; it has not closed above the outer range.
A precise reading is: “The inner range broke upward and price advanced to the outer ceiling.” Calling this a confirmed breakout of the 100–120 range would misidentify what the chart shows.
Separate a shallow handle from a full classical pattern
A cup-and-handle-like structure can organize an internal recovery: price falls away from a rim, returns toward it, makes a shallower pullback, and then breaks upward. The useful details are the depth of the recovery and the handle's boundaries.
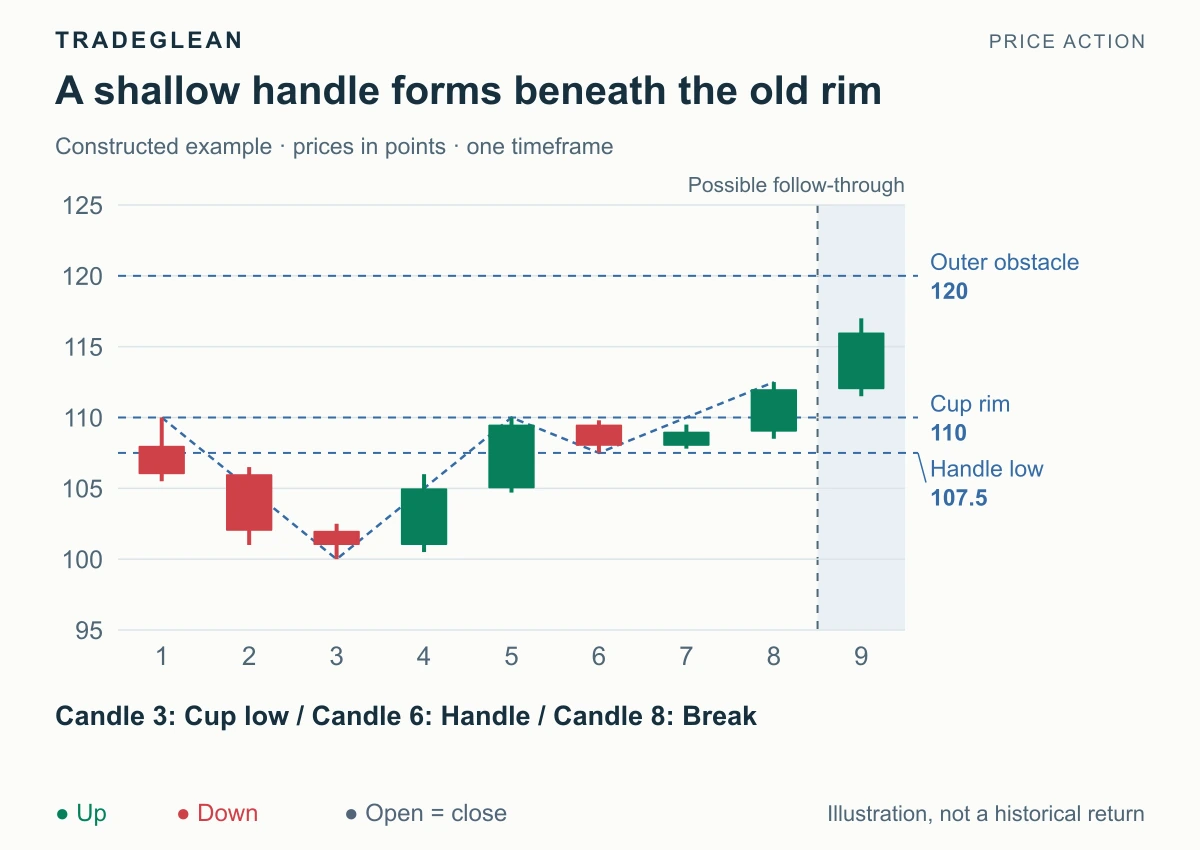
Compact structural illustration, not a claim that nine bars satisfy every duration or volume criterion of a classical cup with handle. The outer obstacle at 120 is assumed to have been identified on the wider chart.
Price descends from the 110 rim to 100, then returns toward 110. Candles 6–7 form a handle with a low of 107.5. This pullback gives back much less than the earlier decline.
Candle 8 closes at 112, above the rim, and candle 9 advances to 116. The bullish reading follows the shallow handle and upward break. The wider obstacle at 120 still matters.
A return below 110 weakens acceptance above the rim. A break below the handle low of 107.5 contradicts the specific shallow-handle setup. Those are different levels of damage, rather than interchangeable stop labels.
Do not confuse speed with preparation
A sharp rally from a range floor can reach its ceiling with very little overlap. Traders sometimes describe this as a vacuum move: price travels quickly toward an area where it may encounter opposing interest.
That description does not prove who traded or why. It also does not establish an IRB, because a fast move need not contain a smaller consolidation.
Classify the visible event first: movement toward an edge, a break within the range, or a break of the entire range. Range-Break Squeezes covers the preparation immediately beside the outer boundary.
Sources and related reading
IRB terminology is associated with Bob Volman's Forex Price Action Scalping. For the longer-duration classical pattern and its additional criteria, see StockCharts' Cup with Handle. The compact example above isolates the price structure.