A Candle Crossing Three EMAs: Recognize the Bullish Setup
Identify a green body crossing the 5-, 10-, and 30-period EMAs, then use a range break and retest to turn that bullish shift into a practical setup.
Candlestick Reading for Beginners
Browse the lessons
The foundations
Reading a single candle
Reversal combinations
Momentum, continuation & breakouts
- Wick Reclaims: Read Bullish and Bearish Continuation5 min read
- Three-Candle Continuation: Identify the Next Push5 min read
- Three White Soldiers and Black Crows: Read the Direction5 min read
- Rising and Falling Three Methods: Spot Trend Continuation5 min read
- Breakout Candles: Identify Bullish and Bearish Breaks5 min read
A green body crossing all three EMAs is a bullish shift
When a completed green candle opens below the 5-, 10-, and 30-period exponential moving averages and closes above all three, the primary reading is bullish. Price has moved from below the recent averages to above them in one candle.
The cleaner application is a bullish shift that also clears a nearby range ceiling or resumes an uptrend after a pullback. If the candle remains below resistance, keep the bullish signal on watch and use a separate price-break condition before treating it as a breakout entry.
How to identify the body-cross setup
This screen uses one completed green candle and three EMA lines calculated from closing prices on the same timeframe.
- Set the averages to EMA5, EMA10, and EMA30.
- At the signal candle's close, read the value of each line.
- The candle's open must be below the lowest of those three values.
- The close must be above the highest of those same three values.
The body therefore spans all three lines at the closing timestamp. A wick that touches or crosses them does not qualify. This is the explicit screen used here; it is not a universal definition shared by every trading platform.
The EMA periods count candles. On an hourly chart they refer to hourly data, not days. A shorter EMA responds faster to recent prices, while the longer line changes more gradually.
Check the example with actual values
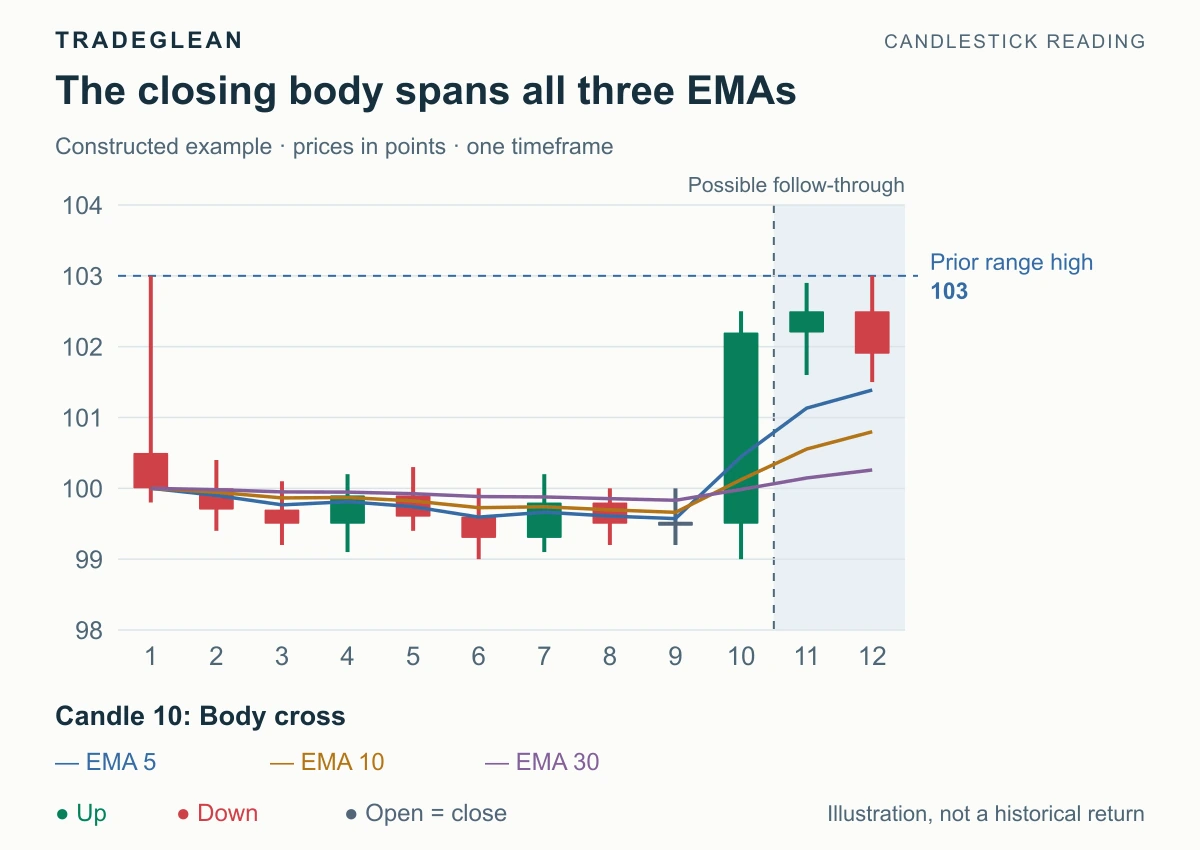
Constructed prices with calculated EMA lines. Green candles close above their opens; red candles below. The signal is candle 10.
| Measurement | Value |
|---|---|
| Open | 99.500 |
| Close | 102.200 |
| EMA5 at the close | 100.448 |
| EMA10 at the close | 100.122 |
| EMA30 at the close | 99.984 |
The open at 99.5 is below 99.984, the lowest line. The close at 102.2 is above 100.448, the highest. Both checks pass, giving a bullish body-cross signal.
For reproducibility, these figures initialize the EMAs at 100 and process 240 warm-up closes at 100 before the visible candles. The lines are not restarted at the cropped chart edge.
Combine the bullish signal with a price breakout
In the first chart, an earlier candle already reached 103. The body cross ends at 102.2, so it has improved the bullish picture without yet clearing that range high. The practical note is “bullish shift; watch for a close above 103.”
The next figure illustrates that follow-through and a later retest.
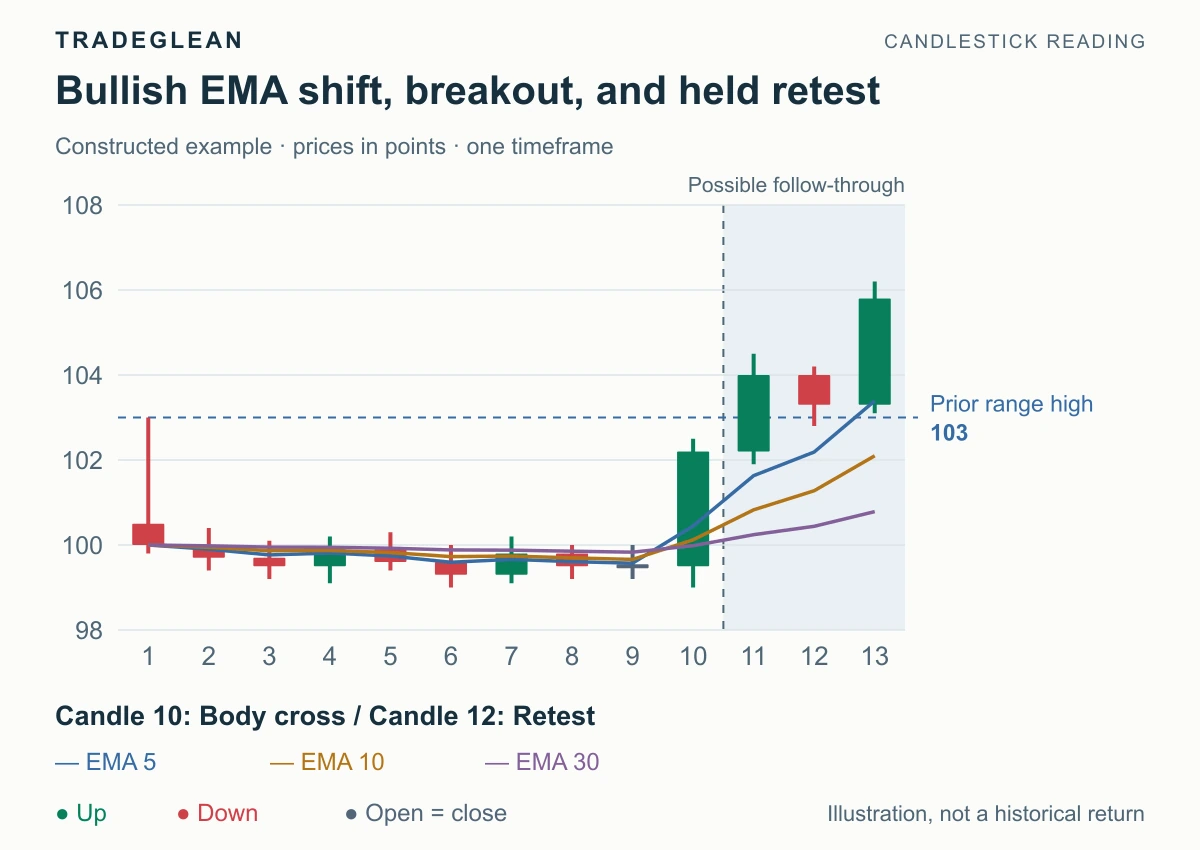
The first ten candles match the body-cross example. Candle 11 closes at 104 above the old high. Candle 12 retests the area and closes at 103.3.
At candle 11, the bullish shift gains a separate range breakout. Candle 12 reaches 102.8 and recovers above 103, giving a pullback structure to evaluate. Candle 13's later upward move illustrates continuation after that retest.
One paper-trading approach could wait for a break above the retest candle's 104.2 high while its low at 102.8 holds. The actual trigger, buffer, stop order, and next resistance must be specified in the plan. The key application is body cross → price breakout → held retest, all pointing in the same direction.
A cross during a downward rebound into resistance deserves more caution than the same sequence breaking a base. Prioritize the combination of the candle and the price structure; three averages alone still summarize the same underlying prices.
Near-miss: only the wick reaches the lines
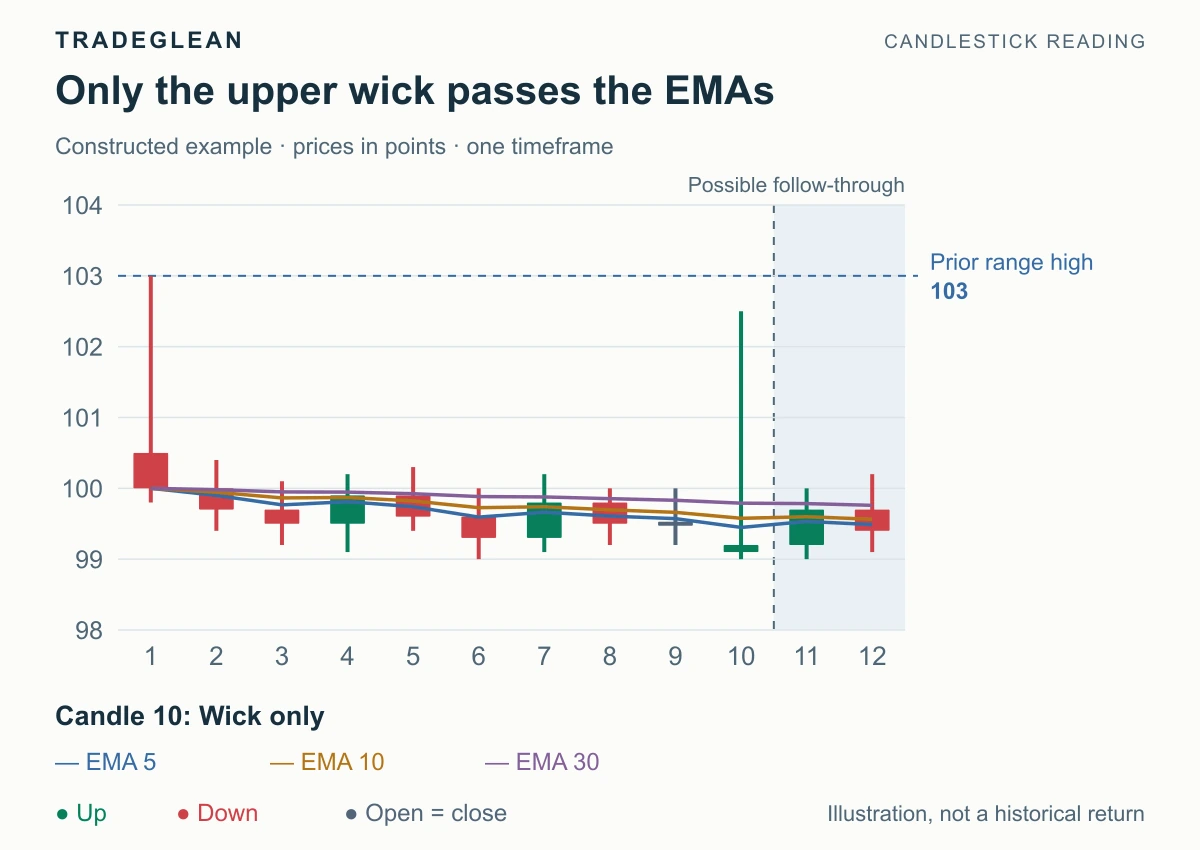
The changed candle opens at 99.1, reaches 102.5, and closes at 99.2.
Its closing EMAs are approximately 99.448, 99.577, and 99.790. Every line is above the body's 99.2 top. The candle is green but does not pass the body-cross definition.
This is why you wait for completion: both the close and the EMA values can change while the candle is live. A screen based on the final body should not treat an earlier intrabar touch as the same signal.
Invalidation and entry space
After a cross and breakout, losing the cleared range area warns that bullish follow-through is weakening. Breaking the retest low invalidates a plan specifically based on that retest holding. A plan using the original signal low has a different boundary and larger risk distance.
Calculate from the entry you can actually take. In the first chart, entry 102.3 and a reference stop at 98.8 create 3.5 points of risk, while resistance at 103 leaves just 0.7 points, or 0.20R. That supports waiting for the breakout and a fresh structure rather than buying solely because the body spans three lines.
The retest example supplies a different structure to assess, not a backdated improvement to the earlier entry. See the plan walkthrough for sizing and execution assumptions.
A brief note on the calculation
The EMA update is current close × a + previous EMA × (1 − a), where a = 2 ÷ (N + 1). For EMA5, a is one-third. If its previous value is 100 and the new close is 103, the updated EMA is 101.
The three-line screen defines a bullish observation, not a measured success probability. Assess any performance claim with a consistent market, timeframe, entry, exit, and costs.
Recognition check
A candle's high crosses all three EMAs but its close stays below the highest line. Does it qualify?
Answer: No. The completed body must open below all three closing values and close above them. When that passes, start with a bullish view and check whether nearby price resistance has also been cleared.
Reference
Fidelity: Exponential Moving Average covers EMA mechanics. The body-cross screen and retest sequence above are constructed educational examples.