Trading-Range Edges: Read Rejections and Reversals
Identify a trading range, distinguish its edges from the middle, and read bullish rejections at the floor or bearish rejections at the ceiling.
Price Action: Trends, Pullbacks & Reversals
Browse the lessons
Bar relationships and channels
Pullbacks and trend development
- High 1, High 2, Low 1, Low 2: Count Pullback Attempts5 min read
- Simple Pullbacks: Find a Clear Trend Restart5 min read
- First Break vs. Second Break: Trade the Pullback Restart5 min read
- Complex Pullbacks and Two-Legged Corrections5 min read
- Spike-and-Channel and Stair-Step Trends: Read the Progress5 min read
Trading ranges and breakout structures
Reversals and chart patterns
- Major Trend Reversals: Read the Break, Test, and Turn4 min read
- Double Tops and Bottoms: Identify the Test and Neckline4 min read
- Head and Shoulders: Identify the Shape and Neckline Break4 min read
- Final Flags: Identify the Failed Last Push4 min read
- Wedges and Three Pushes: Identify the Reversal Setup4 min read
- Contracting and Expanding Triangles: Read the Boundaries4 min read
Measuring the next move
Favor movement back into the range after an edge rejection
When an established range rejects prices below its floor and buying follows, the useful first view is a rebound into the range. When it rejects prices above its ceiling and selling follows, favor a decline back inside. These are conditional edge-reversal setups, not instructions to buy or sell every touch.
The first destination is usually the next internal obstacle or middle area. Reaching the opposite edge requires further progress. A range setup should start with expectations appropriate to a range, rather than assuming that every rebound will launch a new trend.
How to identify a trading range
A trading range contains repeated movement through the same price area with limited sustained progress in either direction. Look for visible turning points that have been tested again.
| Part | How to identify it | Practical role |
|---|---|---|
| Floor | A zone where declines have repeatedly stopped or recovered | Location to examine for bullish rejection |
| Ceiling | A zone where advances have repeatedly stalled or fallen back | Location to examine for bearish rejection |
| Middle | The area between the boundaries, often with substantial overlap | A nearer management or obstacle area |
There is no universal minimum number of candles. Two meaningful tests of each side give a clearer basis for a box than one initial pullback. Boundaries can be zones rather than exact prices, and some ranges slope or broaden instead of forming a neat rectangle.
A tight cluster of at least three heavily overlapping candles, including a doji, is often called barbwire in price-action terminology. It describes congestion. An inside-bar or IOI label can exist within it, but those local patterns do not remove the surrounding lack of space.
A failed break below the floor
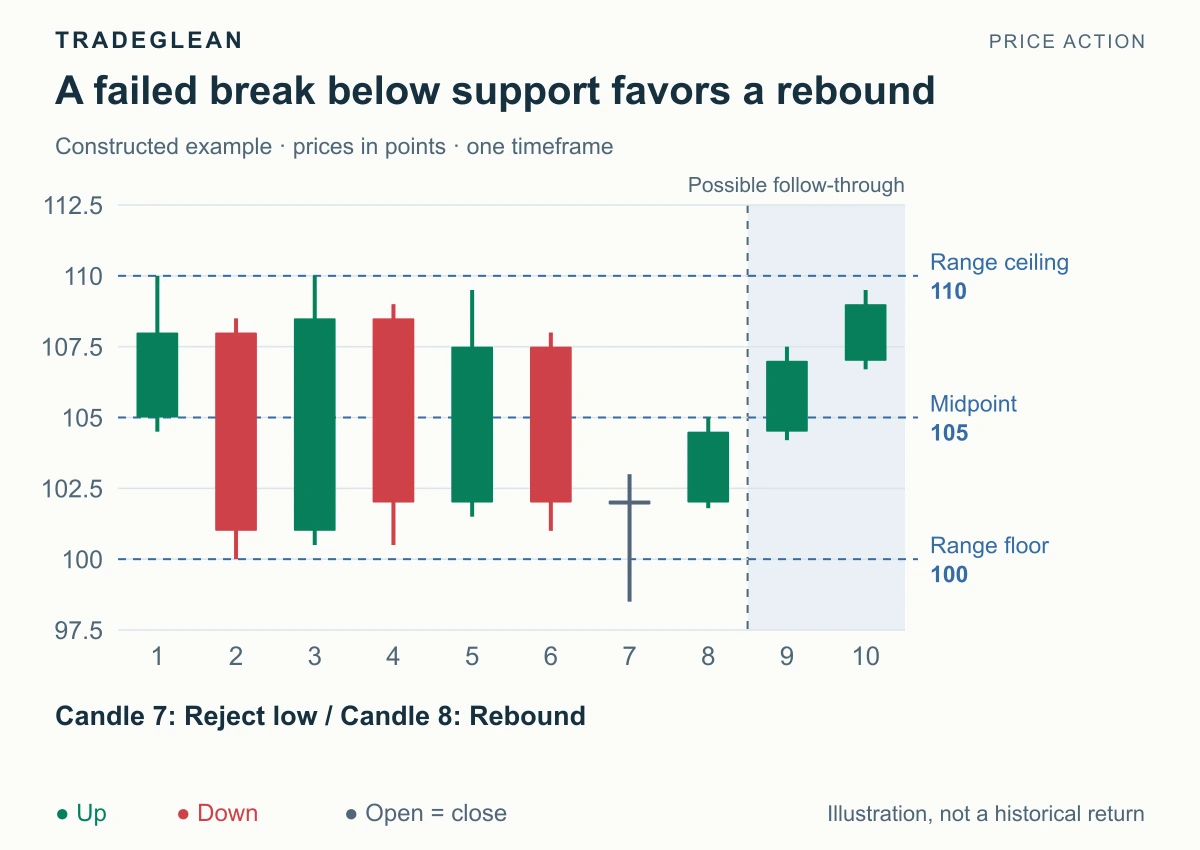
Constructed prices, green up and red down. Earlier highs test 110, while earlier lows test the 100 area.
Candle 7 trades to 98.5, below the 100 floor, but closes back at 102. Its high is 103. The low excursion has been rejected by the close. Candle 8 then exceeds 103 and closes at 104.5, adding upward follow-through.
The working reading is bullish recovery into the range. The midpoint at 105 is the first displayed reference, followed by the 110 ceiling if the rebound continues. The later candles illustrate that upward progress, but it was not known when the rejection first formed.
A plan built on this rejection holding must respect the 98.5 extreme or another explicitly chosen local structure. If price returns below that extreme and keeps declining, the bullish rejection thesis has failed. The old floor cannot remain a reason to buy regardless of what subsequent closes do.
The trigger also affects available space. By the time price closes at 104.5, it is already close to the midpoint. A later entry cannot claim the distance available earlier near the floor. Use the existing trading-plan guide to compare entry, protection, and the nearest obstacle.
A failed break above the ceiling
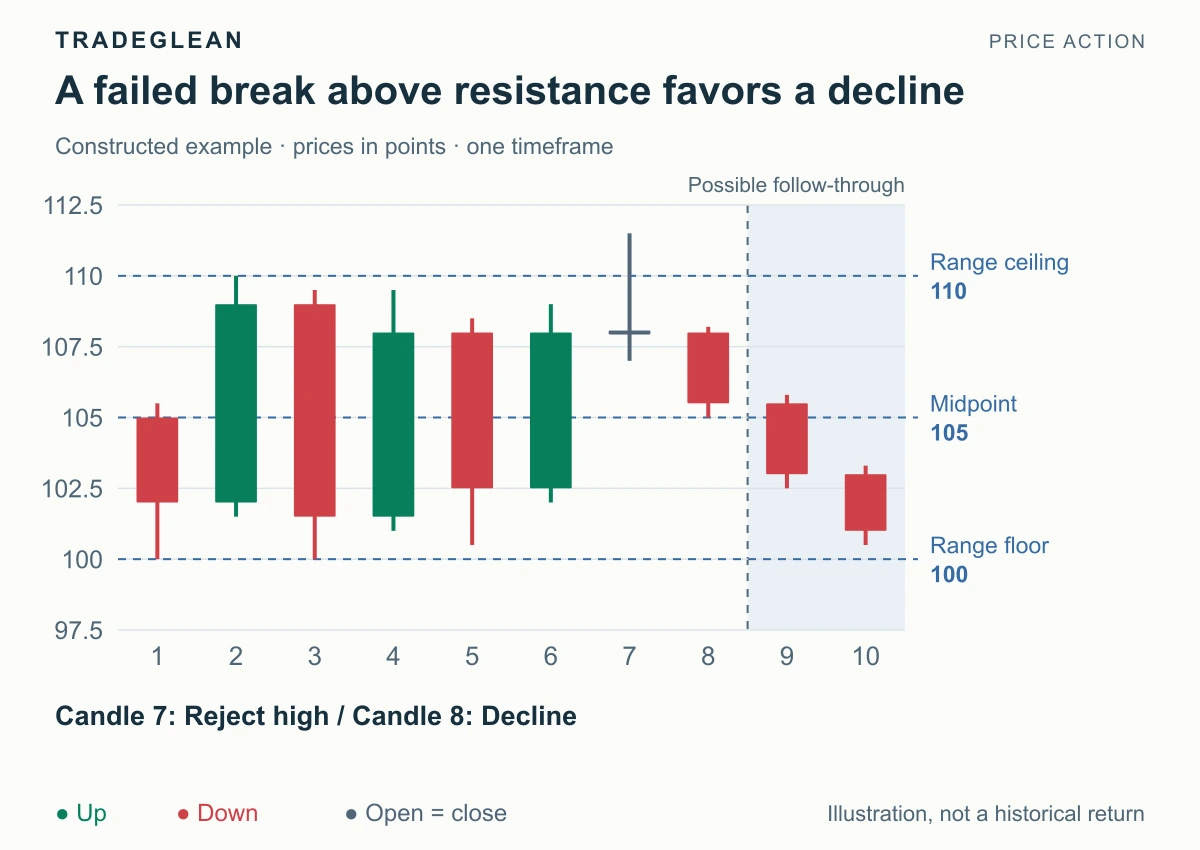
In the bearish mirror, candle 7 reaches 111.5 above the 110 ceiling and closes back at 108. Its low is 107. Candle 8 breaks below 107 and closes at 105.5, supporting renewed selling into the range.
The primary view is a decline toward the 105 midpoint and, if selling continues, the 100 floor. A recovery above the rejected 111.5 high would undermine a bearish plan based on that ceiling rejection.
The examples use a small-body rejection followed by directional movement. Other signals can serve the same location, including the shooting star or engulfing patterns already covered in the candlestick collection. Their identification rules remain the same; this article supplies the range-specific setting.
Distinguish a rejection from a genuine escape
A brief excursion outside followed by a close back inside is an initial rejection observation. Continued closes outside, successful retests from the other side, and new swing progress support a different reading: the range may be breaking.
For example, a decline that closes below 100 and continues lower has not produced the bullish recovery shown above. Buying solely because the chart used to have a 100 floor would ignore the new evidence. Equally, one wick above 110 is not proof that a sustained bullish breakout has occurred.
The breakout-candle guide covers the completed-close distinction. Here, the additional question is whether an actual rejection at an established edge provides a directional setup back into the range.
Why the middle is a different location
A large green candle moving from the middle toward the ceiling can consume most of the available upward space. Its size does not make the ceiling disappear. A large red candle approaching the floor creates the same issue in reverse.
Waiting at a meaningful edge lets you connect the signal to a visible structural reason. Trading every small fluctuation in the middle tends to mix unrelated triggers, nearby obstacles, and repeated reversals. If the boundaries are too close relative to the signal and costs, the range may be readable without offering a suitable entry.
If price begins clustering at one edge rather than returning across the box, update the analysis. Rising lows beneath resistance can favor an upward breakout; falling highs above support can favor a downward one. That shift is the subject of RB squeeze structures.
Further reading
Brooks' glossary defines trading ranges and barbwire. For larger two-test reversals, see double tops and double bottoms.