Complex Pullbacks and Two-Legged Corrections
Recognize ABC corrections within a trend, separate swing structure from entry counts, and identify the levels that support continuation or invalidate it.
Price Action: Trends, Pullbacks & Reversals
Browse the lessons
Bar relationships and channels
Pullbacks and trend development
- High 1, High 2, Low 1, Low 2: Count Pullback Attempts5 min read
- Simple Pullbacks: Find a Clear Trend Restart5 min read
- First Break vs. Second Break: Trade the Pullback Restart5 min read
- Complex Pullbacks and Two-Legged Corrections5 min read · You are here
- Spike-and-Channel and Stair-Step Trends: Read the Progress5 min read
Trading ranges and breakout structures
Reversals and chart patterns
- Major Trend Reversals: Read the Break, Test, and Turn4 min read
- Double Tops and Bottoms: Identify the Test and Neckline4 min read
- Head and Shoulders: Identify the Shape and Neckline Break4 min read
- Final Flags: Identify the Failed Last Push4 min read
- Wedges and Three Pushes: Identify the Reversal Setup4 min read
- Contracting and Expanding Triangles: Read the Boundaries4 min read
Measuring the next move
Look for the trend to resume from a defined correction
After an uptrend develops a two-legged downward correction, a break back above the intervening rebound high supports an upward restart. In a downtrend, a two-legged upward correction supports renewed selling once price breaks back below the intervening reaction low.
This gives the correction a practical directional use. You are watching the original trend try to recover from a specific structure, with a visible point where that recovery would fail.
A correction can become complex before it produces that trigger. Repeated overlap, deeper swings, or a new range require a larger structural view than the simple-pullback setup.
How to identify a complex pullback
First name the trend being corrected. The same price movement may be a pullback within an hourly uptrend and a small downtrend on a shorter chart. Keep the reference timeframe fixed.
A complex pullback contains more substantial back-and-forth movement than a brief, orderly pause. It can form a box, channel, triangle, two-legged correction, or a combination. There is no fixed candle count that changes a simple pullback into a complex one.
For the clean two-legged version, identify three movements:
| Segment | Correction of an uptrend | Correction of a downtrend |
|---|---|---|
| A | First downward leg | First upward leg |
| B | Intervening rebound | Intervening decline |
| C | Second downward leg | Second upward leg |
A and C are the two legs moving against the original trend. B separates them. Calling the structure “two-legged” does not mean there are only two line segments on the chart.
Use meaningful swing pivots at one scale. Counting every tiny fluctuation can manufacture a complicated correction where the larger structure is straightforward.
A bullish restart after two downward legs
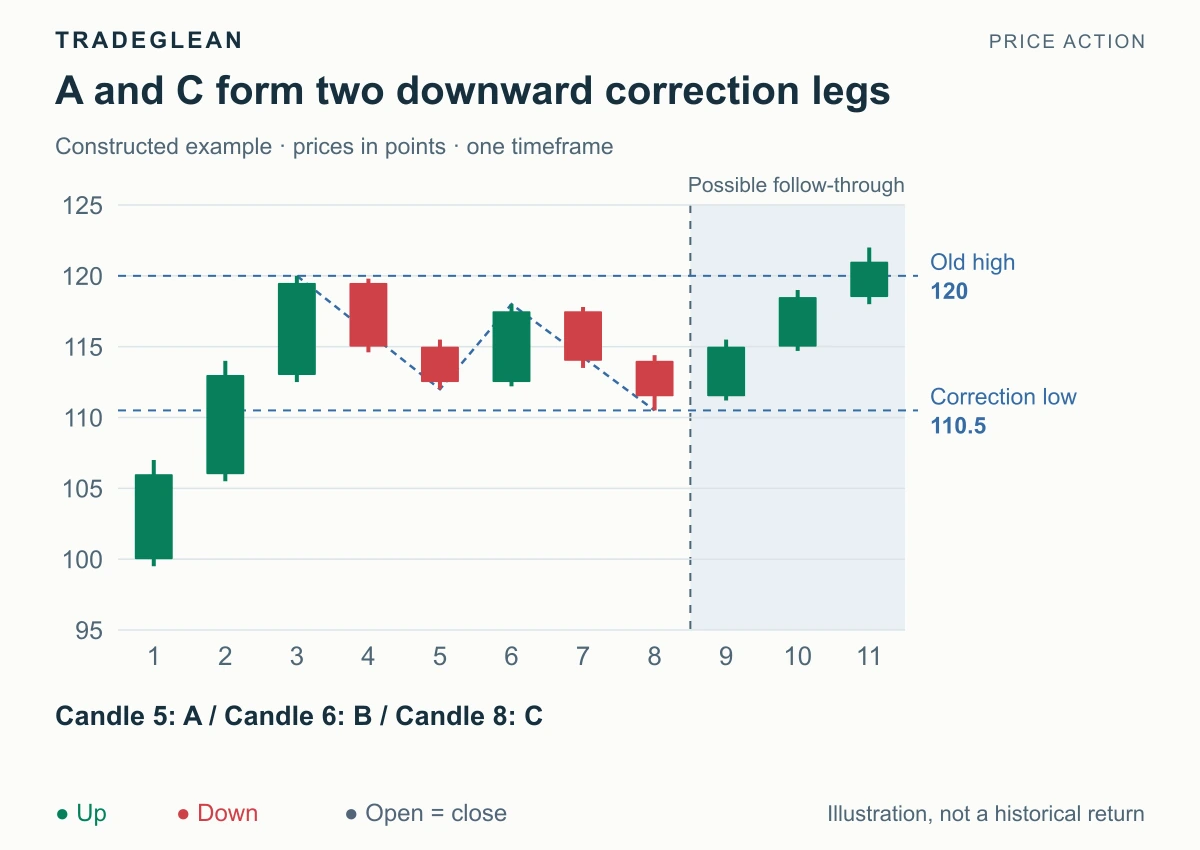
Constructed prices. Green closes above open; red closes below. A, B, and C label movements ending at the marked pivots.
The upward impulse reaches 120 at candle 3. Leg A ends at candle 5's 112 low. The B rebound reaches 118 at candle 6. Leg C then ends at candle 8's 110.5 low.
Candle 9 recovers to a 115 close, showing buying from the second leg's low. Candle 10 closes at 118.5, above the 118 B high. That supplies the stronger structural restart in this example: buyers have recovered the entire intervening rebound level.
The primary view is now bullish continuation toward the old 120 high. The correction low at 110.5 is the reference for a thesis that the full correction has ended. Candle 11 subsequently closes at 121, beyond the old high, adding evidence of a renewed trend leg.
An earlier entry signal near C would give a different entry price and require its own local definition. Do not claim that the later break above 118 was already known at the 110.5 low. A clearer confirmation can arrive at a less favorable price; both facts belong in the explanation.
A bearish restart after two upward legs
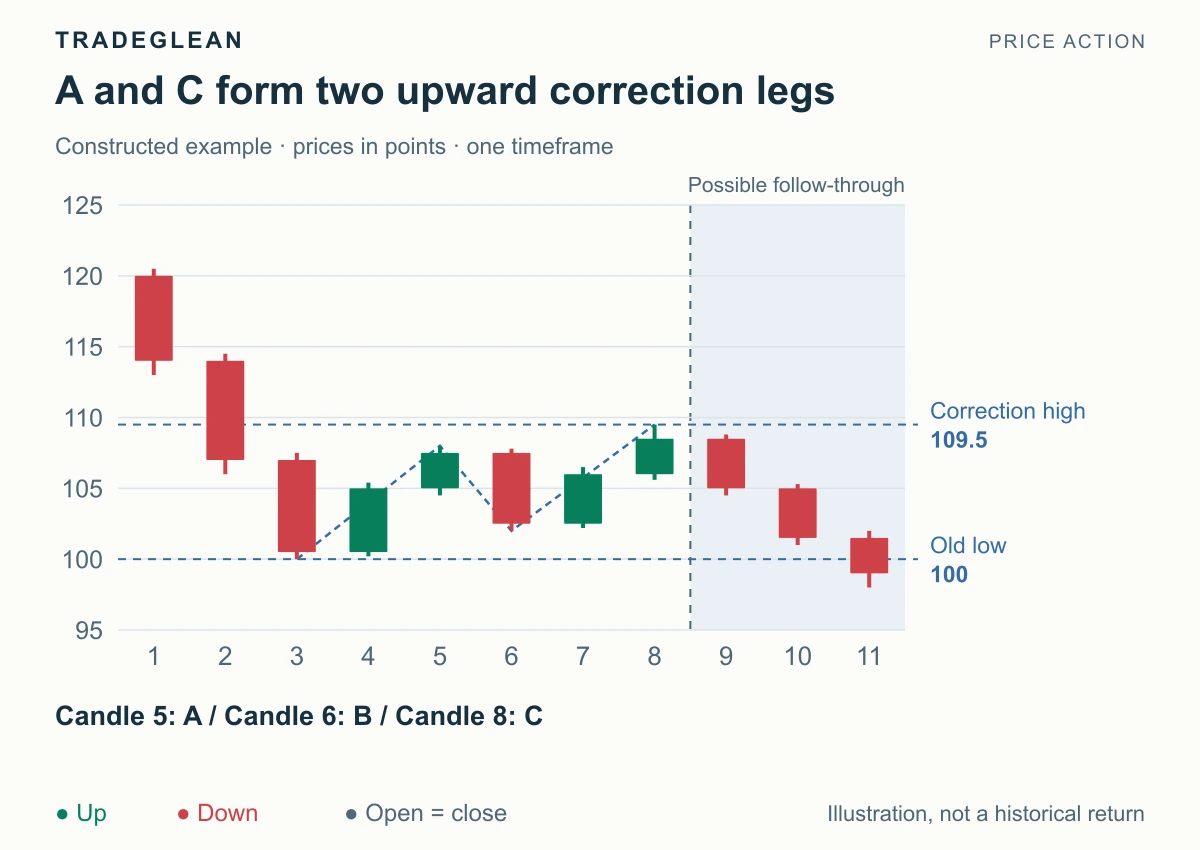
The original decline reaches 100. A rebounds to 108, B falls to 102, and C reaches 109.5. Candle 10 later closes at 101.5, below the B low at 102. The directional reading is renewed bearish movement toward the old 100 low.
The correction high at 109.5 is the structural reference above. A recovery beyond it would contradict a plan requiring the upward correction to have ended. Candle 11 closes at 99 in this illustration, extending the decline beyond the previous extreme.
The second correction leg can end above, near, or below the first leg's extreme, depending on the structure. The letters organize the movements; the restart trigger and invalidation still need actual prices.
Two legs do not automatically mean H2 or L2
A, B, and C describe swing movements. H1/H2 and L1/L2 describe successive attempts based on adjacent candle highs or lows. One correction leg can contain several small attempts. Another may end with only a single clear trigger.
Use the larger correction to find the location, then use the smaller signal if your method calls for one. Do not label the end of C “H2” merely because C is the second downward leg. That skips the required adjacent-candle comparisons.
Distinguish continuation, range formation, and failure
An uptrend correction that clears the old high with sustained follow-through supports continuation. A rebound that repeatedly stalls near the old high and returns to the correction low suggests a range is becoming more relevant. A break below the correction's important support, accompanied by downward follow-through, adds evidence against the old bullish thesis.
These are different structural events. A pause near the old high is not the same as a confirmed bearish reversal. Equally, a completed bullish restart that later breaks its protective structure has failed, even if a much larger uptrend eventually resumes.
If the correction expands into a broad box, use that box's current boundaries. Do not indefinitely preserve the first narrow entry plan while the market builds a different structure around it.
Keep targets tied to the visible obstacles
In the bullish example, 120 is the first major obstacle after the break above 118. A farther equal-leg projection belongs beyond that obstacle and requires further progress. The measured-move guide explains how to calculate such a reference without confusing it with a promised destination.
The immediate application is simpler: identify A, B, and C; mark the intervening pivot; look for a break back in the original trend direction; and retain the correction extreme as an explicit failure reference when that is the structure your plan uses.
Further reading
Brooks' glossary describes legs and pullbacks. For repeated tests that have become a sideways structure, continue with trading-range edges.