Learn to read a chart
A practical starting point for understanding candles, market structure, support and resistance, and the risks behind the chart.
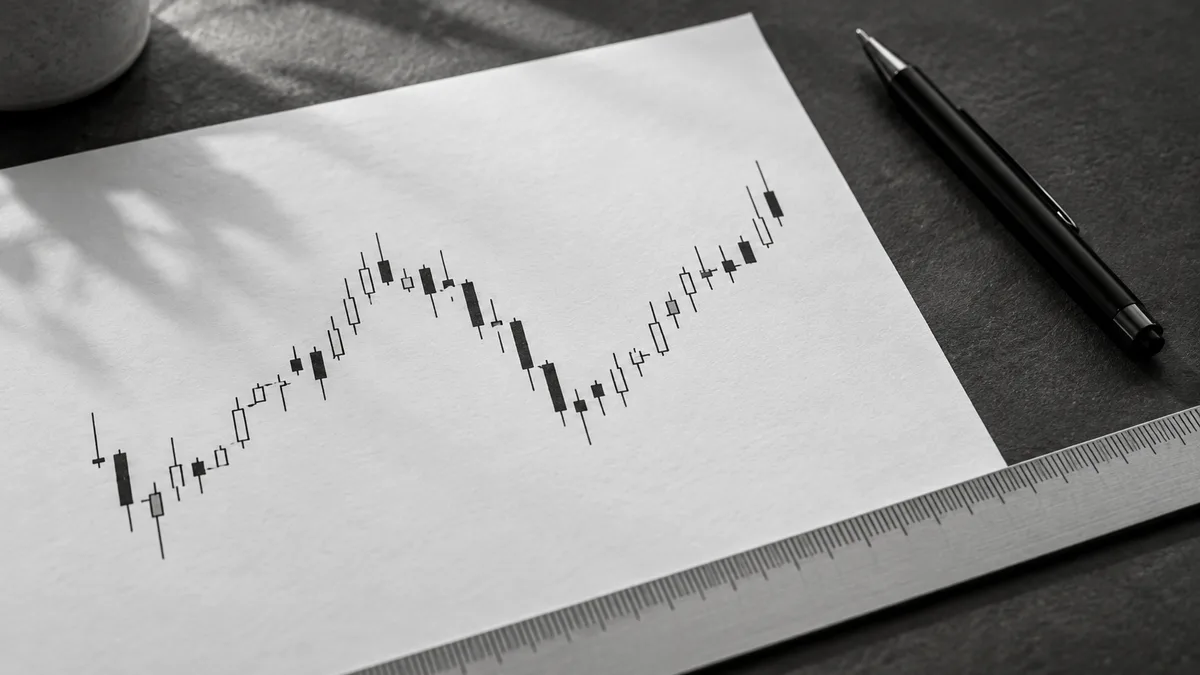
Candlesticks
Before interpreting a chart, identify the instrument, data source, timezone, and timeframe. A one-hour candle summarizes one hour; it is not the same observation as a daily candle. Different feeds and session boundaries can produce different candles.
Each completed candle records four prices: open, high, low, and close. The body connects the open and close; the wicks extend to the high and low. Color conventions depend on your chart settings. An unfinished candle can still change.
Start by describing a candle without predicting the next one. Is its body large or small relative to nearby candles? Where did it close within its range? A long wick records an excursion in price; it does not prove why the move happened or guarantee a reversal. CME Group's chart-type guide explains how these price records are displayed.
Market structure
Step back from individual candles and look at the sequence of price swings. A swing high is a local peak; a swing low is a local trough. The choice of timeframe and how you identify swings affect the picture.
A sequence of higher highs and higher lows is commonly described as an uptrend. Lower highs and lower lows describe a downtrend. Overlapping swings without clear progress can describe a range. These are descriptions of what has happened, not promises about the next move.
Compare your chosen timeframe with a broader view. A short upward move can sit inside a larger decline. Write both observations down rather than selecting only the view that supports your first impression.
Support and resistance
Support is an area where a decline may slow or reverse; resistance is an area where a rise may slow or reverse. Previous swing highs and lows are common starting points for marking them.
Treat these as zones to observe, not precise barriers. Price can cross a level, return through it, or continue beyond it. A previously important area may lose relevance as conditions change. CME Group discusses these ideas in its support and resistance lesson.
For a learning exercise, mark only a few clear areas and record why you selected them. Observe the next interaction without moving every line afterward to make the earlier analysis appear correct.
Risk
Reading a chart does not establish whether a product is appropriate for you. XAUUSD identifies a gold quotation in US dollars; the actual contract could have terms very different from physical gold. Forex and crypto instruments also vary by provider, product, and location.
Before considering a real transaction, understand the contract size, spread, commissions, financing or funding charges, margin requirements, and liquidation rules. A small price move can have a large effect on a leveraged position. Depending on the product and protections, losses can exceed the deposit. The CFTC's forex advisory explains this risk.
Crypto introduces additional concerns, including custody, fraud, and provider failure. Use Investor.gov's crypto resources as a starting point for further reading. Regulations and protections differ across countries.
Practice
Use a historical chart or a demo environment to practice observation without committing money. Simulation cannot reproduce every cost, fill, or emotional pressure of live trading.
- Choose one chart. Record its instrument, source, date, timezone, and timeframe.
- Describe what is visible. Note the recent swings and a few candles in neutral language.
- Mark context. Identify a small number of possible support and resistance zones.
- Write an alternative. Describe what would contradict your interpretation before looking ahead.
- Review the result. Compare the next section of the chart with your notes. Keep the original notes, including mistakes.
Repeat the same exercise over several examples, including quiet and volatile periods. The useful outcome is a clearer description and an honest record of uncertainty, not a manufactured win rate. This guide is educational and provides no trade signal or personalized advice. Read the risk disclosure for more context.
Sources and further reading
Sources were checked on September 10, 2026. CME Group, CFTC, and Investor.gov resources are linked beside the relevant explanations above. Their inclusion does not imply endorsement of TradeGlean or that US rules apply to every reader.
See the editorial policy for how this publication approaches evidence and corrections.