Trend Lines and Price Channels: Draw the Right Boundaries
Identify rising and falling channels, distinguish trend lines from channel lines, and use shallow or deep pullbacks to judge the strength of a move.
Price Action: Trends, Pullbacks & Reversals
Browse the lessons
Bar relationships and channels
Pullbacks and trend development
- High 1, High 2, Low 1, Low 2: Count Pullback Attempts5 min read
- Simple Pullbacks: Find a Clear Trend Restart5 min read
- First Break vs. Second Break: Trade the Pullback Restart5 min read
- Complex Pullbacks and Two-Legged Corrections5 min read
- Spike-and-Channel and Stair-Step Trends: Read the Progress5 min read
Trading ranges and breakout structures
Reversals and chart patterns
- Major Trend Reversals: Read the Break, Test, and Turn4 min read
- Double Tops and Bottoms: Identify the Test and Neckline4 min read
- Head and Shoulders: Identify the Shape and Neckline Break4 min read
- Final Flags: Identify the Failed Last Push4 min read
- Wedges and Three Pushes: Identify the Reversal Setup4 min read
- Contracting and Expanding Triangles: Read the Boundaries4 min read
Measuring the next move
Follow the channel's direction first
A rising channel with higher swing lows supports an upward view. A falling channel with lower swing highs supports a downward view. The channel's width then tells you how much movement against that direction is occurring.
A tight upward channel can remain strong even when individual bodies look small. A broad upward channel still rises, but its deeper pullbacks make the opposite side more visible. These differences matter when deciding whether you are looking for a brief continuation or a larger return toward a boundary.
A channel is a way to organize observed swings. The lines should make those swings easier to read, not create a route that price is obliged to follow.
How to identify and draw a price channel
A channel contains repeated swings between two roughly aligned boundaries. Start with clear turning points on a fixed timeframe, including their wick extremes.
| Direction | Trend line | Trend channel line |
|---|---|---|
| Rising channel | Lower boundary through pullback lows | Upper boundary near rally highs |
| Falling channel | Upper boundary through rebound highs | Lower boundary near declining lows |
Two well-separated pivots establish a provisional line. A later test near it gives another check. Avoid joining tiny adjacent fluctuations merely to manufacture a steep line. You can first identify one reliable boundary and leave the other provisional.
In a parallel channel, the boundaries have similar slopes. Converging boundaries narrow the space; diverging boundaries widen it. Those geometric descriptions do not override the underlying swing direction. Triangles and wedges receive their own treatment later in this collection.
A rising channel with measurable boundaries
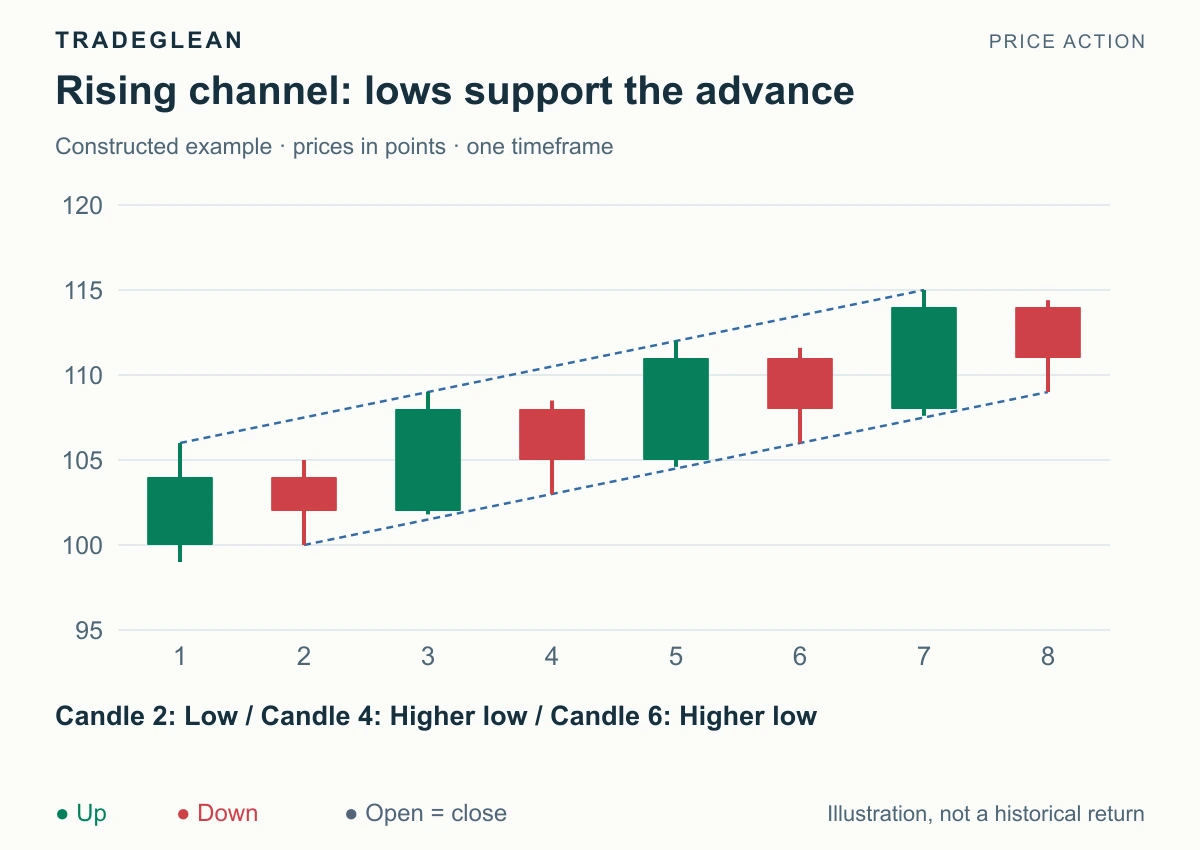
Constructed prices; green up and red down. The dashed lines join observed wick pivots.
The pullback lows at candles 2, 4, 6, and 8 are 100, 103, 106, and 109. They define the lower trend line. The upper extremes at candles 1, 3, 5, and 7 are 106, 109, 112, and 115. The two boundaries rise at the same rate in this clean example.
The working direction is bullish because pullback lows and rally highs both advance. A return toward the lower boundary is a location to examine for renewed buying. Look for a completed recovery signal and a break back upward; touching the dashed line by itself is only a location event.
At candle 8, price has reached a new pullback low at 109 and closed at 111. The chart ends before a renewed upward trigger appears. A continuation plan can prepare around that low, but it cannot record a recovery entry that has not occurred. The next rally high and upper boundary are obstacles to evaluate once a trigger exists.
The falling-channel mirror
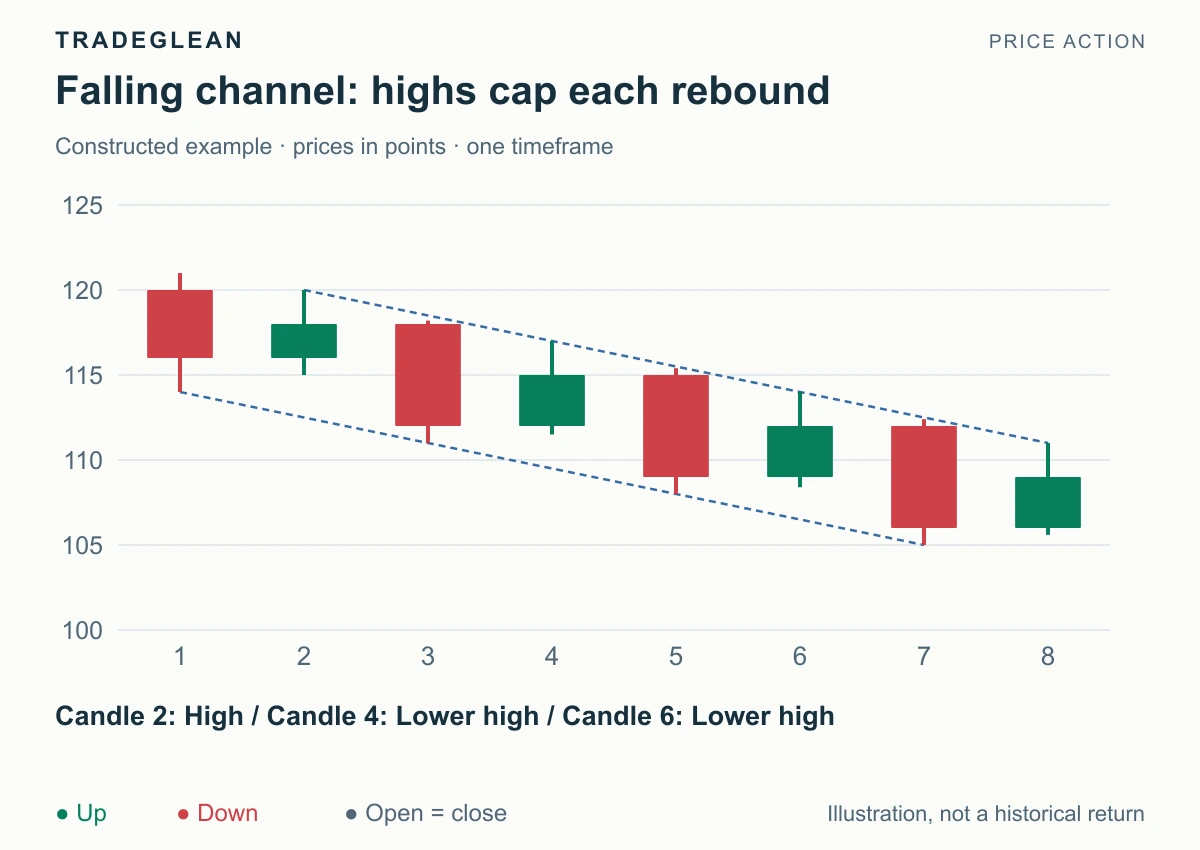
The rebound highs at candles 2, 4, 6, and 8 are 120, 117, 114, and 111. They form the upper trend line supporting a bearish reading. The declining opposite boundary lies near the lower extremes at 114, 111, 108, and 105.
Here, a rebound toward the upper boundary is the relevant location for a renewed downward signal. A small green candle near the lower edge is not enough to establish a bullish trend reversal. First identify whether the rally can break the channel's supporting structure and produce stronger upward follow-through.
Protection belongs beyond the structure that the setup requires to hold. A bearish rejection of the most recent rebound high uses that high as a reference. A wider thesis about the whole channel may need a different boundary, so it also needs a separate risk calculation.
Tight, broad, and micro channels
A tight channel allows only shallow pullbacks. A broad channel contains substantial countertrend swings, even while its major pivots continue in the original direction. Judge the depth of those swings, not just the distance between two lines on a zoomed-out screen.
A micro channel is an especially persistent bar-by-bar sequence. In the strict rising example below, each candle's low exceeds the previous candle's low. A strict falling version has successively lower highs.
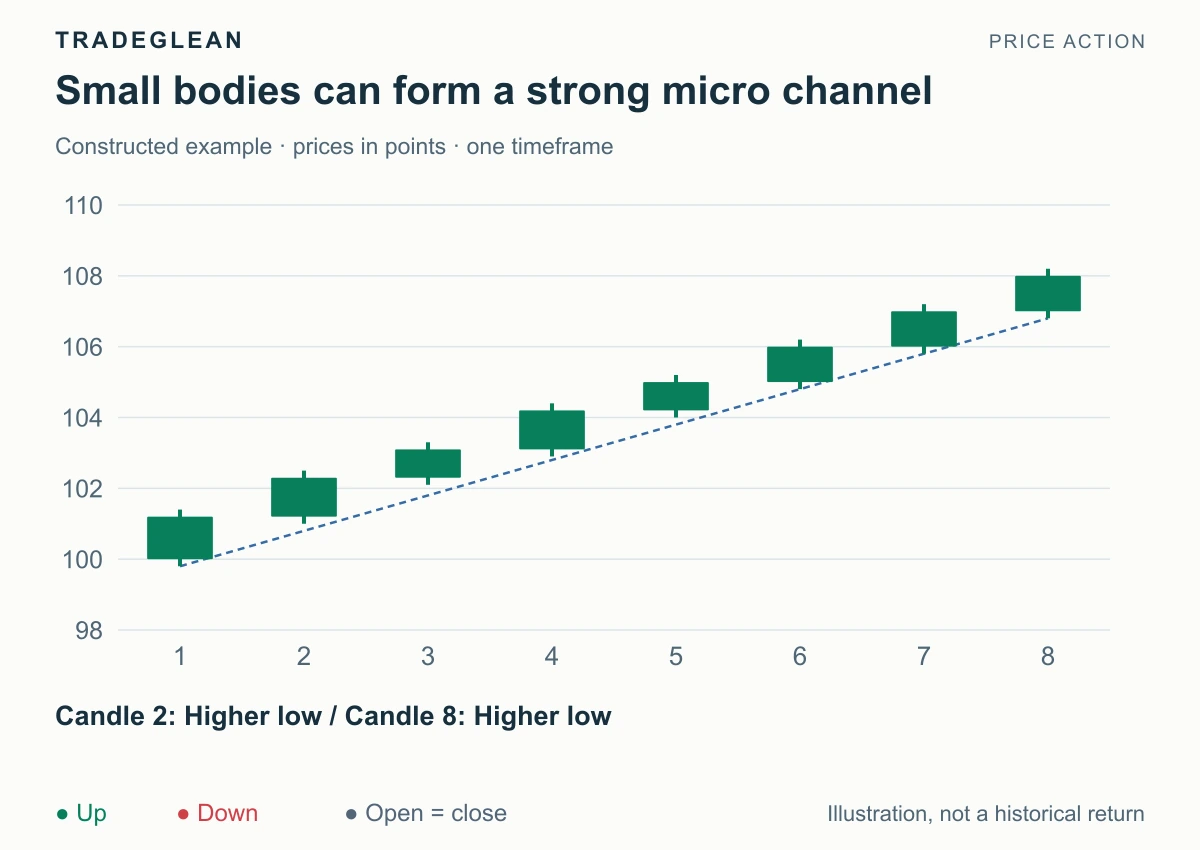
The bodies are modest, yet sellers never take price below the previous candle's low. The useful reading is continued upward pressure. Selling merely because the bodies are small would miss what the sequence is doing.
A first break of that micro sequence interrupts the local pattern. It does not, on its own, prove that the larger trend has reversed. Check whether the interruption becomes a deeper pullback, a range, or a genuinely opposite swing structure.
When the channel reading changes
A sustained break through the trend line weakens the old continuation thesis. The next test matters: can price return to the old trend extreme, or does it form a lower high after an uptrend or a higher low after a downtrend? That sequence leads into major trend reversals.
A break beyond the opposite channel line is different. An upward break above a rising channel can accelerate the trend. If it quickly returns inside, it is a failed acceleration attempt. It is not automatically proof of a full bearish reversal.
Do not keep moving a boundary solely to preserve a losing interpretation. Redraw it when new pivots justify a different structure, and explain which points changed. The new drawing does not erase an earlier setup's invalidation.
Further reading
Brooks' price-action glossary covers trend lines, trend channel lines, and micro channels. See trend development for the progression from a fast move to a channel or a series of higher ranges.