Final Flags: Identify the Failed Last Push
Recognize a final-flag reversal through a pause, one more trend extension, and a confirmed return through the flag's opposite boundary.
Price Action: Trends, Pullbacks & Reversals
Browse the lessons
Bar relationships and channels
Pullbacks and trend development
- High 1, High 2, Low 1, Low 2: Count Pullback Attempts5 min read
- Simple Pullbacks: Find a Clear Trend Restart5 min read
- First Break vs. Second Break: Trade the Pullback Restart5 min read
- Complex Pullbacks and Two-Legged Corrections5 min read
- Spike-and-Channel and Stair-Step Trends: Read the Progress5 min read
Trading ranges and breakout structures
Reversals and chart patterns
- Major Trend Reversals: Read the Break, Test, and Turn4 min read
- Double Tops and Bottoms: Identify the Test and Neckline4 min read
- Head and Shoulders: Identify the Shape and Neckline Break4 min read
- Final Flags: Identify the Failed Last Push4 min read · You are here
- Wedges and Three Pushes: Identify the Reversal Setup4 min read
- Contracting and Expanding Triangles: Read the Boundaries4 min read
Measuring the next move
A final flag becomes a reversal setup when one more push in the old trend's direction fails and price turns through the flag. After an uptrend, that sequence supports a bearish reading. After a downtrend, it supports a bullish reading.
The word “final” describes what the later price action establishes. While a flag is still forming, it is a pause with a continuation possibility. Calling every late-looking pause a final flag would predict a reversal before its evidence exists.
How to recognize the sequence
A useful working definition has four parts:
- A trend: price has already made a visible directional move.
- A flag: a bounded pause or small countertrend consolidation forms.
- One more extension: price breaks from the pause in the old trend's direction.
- Failure and reversal: the extension loses ground, price returns through the flag, and breaks the opposite boundary.
A mature or unusually stretched advance makes exhaustion worth watching, but it does not supply step 4. The final push can initially look like an ordinary successful continuation.
Distinguish this sequence from a flag that simply breaks the opposite way without first extending the old trend. Both can be useful structures, but only the former matches the particular last-push example explained here.
An upward final push becomes a bearish reversal
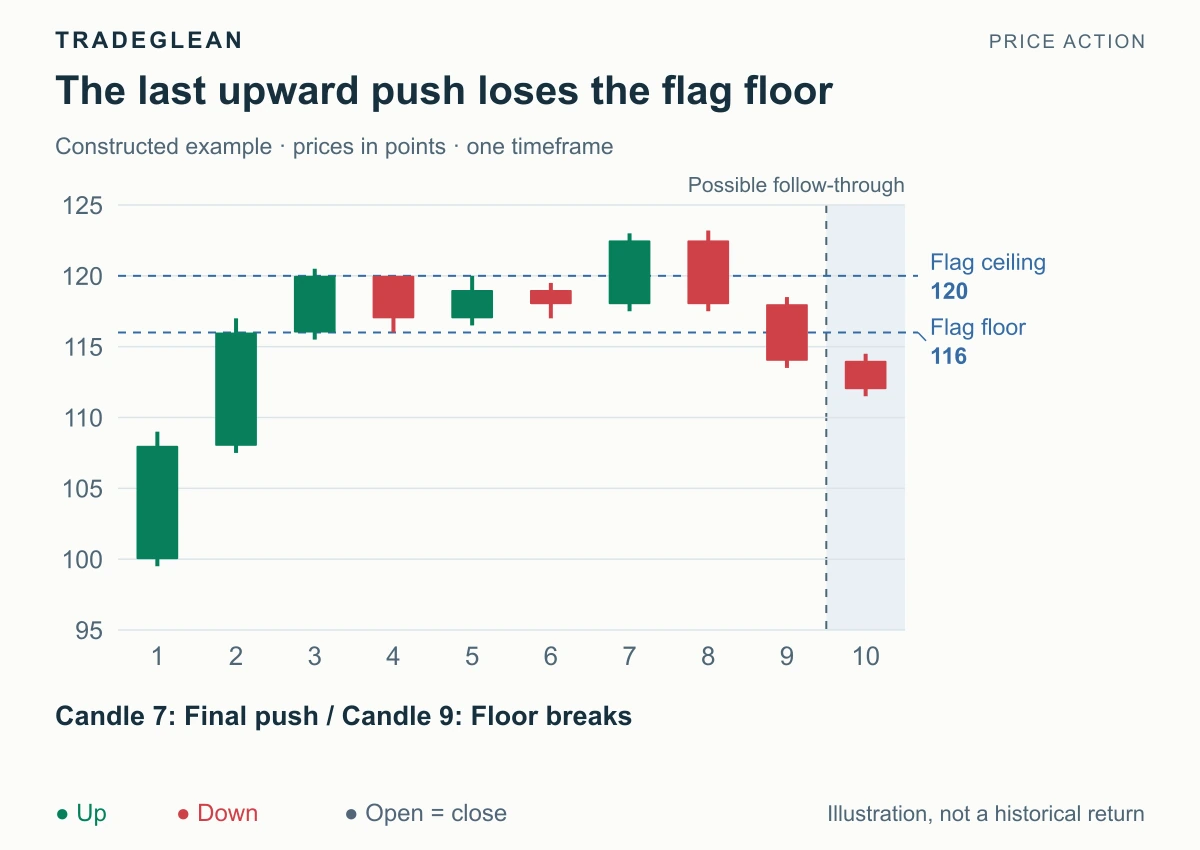
Constructed example. Candle 10 shows movement after the opposite-boundary break.
Candles 1–3 advance from 100 to a close at 120. Candles 4–6 form a pause bounded by 116 and 120.
Candle 7 closes at 122.5, above the flag. At that moment, the visible event is an upward continuation attempt. It would be premature to declare that buyers had already failed.
Candle 8 reaches 123.2 but closes at 118, back inside the flag. The upward break is losing acceptance. Candle 9 then closes at 114, below the 116 floor.
The main reading is now bearish: the last extension failed, and sellers have carried price through the entire pause. Candle 10 closes at 112, illustrating continued downward movement.
The confirmed reversal is stronger evidence than a small red candle above the flag. The key difference is where price closes relative to the structure.
Follow the bullish mirror after a decline
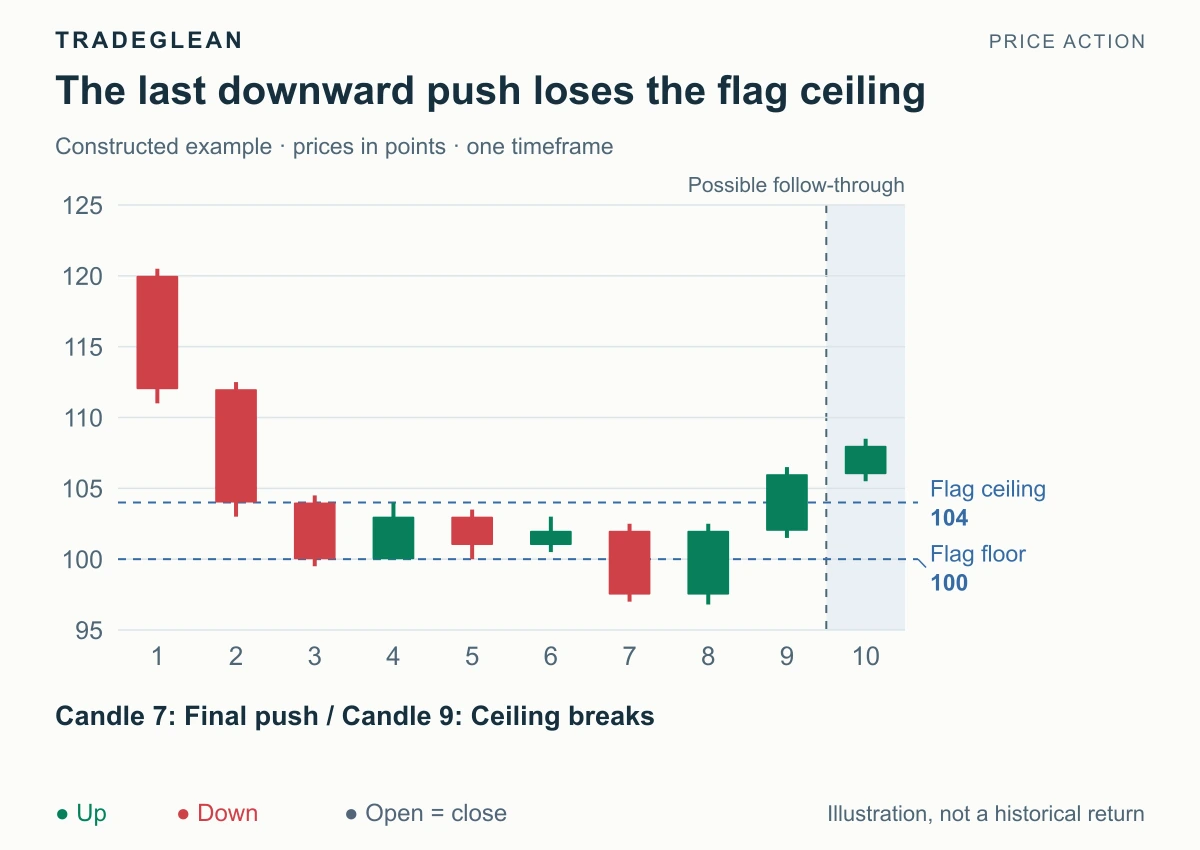
The falling market pauses between 100 and 104. Candle 7 closes at 97.5, extending the decline. Candle 8 reaches 96.8 but closes at 102, back inside the flag.
Candle 9 closes at 106, above the 104 ceiling. Buyers have reversed the downward extension and broken through the opposite side of the pause. The completed sequence favors a further upward move; candle 10 illustrates one with a close at 108.
The bullish signal is not “the market has fallen a lot.” It is the observable failure of the last downward push followed by an upward break.
Separate the early warning from the trigger
| Stage | What can reasonably be said |
|---|---|
| Flag still forming | A pause is present; watch the next attempt |
| Trend extension occurs | The old direction is trying to continue |
| Price reenters the flag | That extension is weakening |
| Opposite edge breaks | The reversal has a structural trigger |
This separation keeps the article's main direction clear without pretending that the full result was knowable at the first pause.
A late flag may help an existing position holder recognize deteriorating continuation. That observation does not automatically create a new opposite-direction entry. The new setup still needs its own trigger and sufficient room to the next visible obstacle.
Know what would contradict the reversal
In the bearish example, a sustained recovery above the broken 116 floor weakens the immediate breakdown. A recovery above the full extension high of 123.2 contradicts the broader failed-upward-push premise.
In the bullish example, sustained loss of the recovered 104 ceiling weakens the breakout. A fall below the extension low of 96.8 contradicts the broader failed-downward-push premise.
A local reversal can become a larger correction before a new long trend develops. Keep the conclusion attached to the chart's actual scale. For a more developed change involving a trend break and a test of the old extreme, see Major Trend Reversals.
Further reading
Al Brooks discusses final flags in his price-action pattern overview. Related exhaustion structures are explained in Wedges and Three-Push Reversals.