Morning Star vs. Evening Star: Identify the Turn
Recognize the three candles of a morning or evening star, check the final close, and apply the bullish or bearish reversal signal in practice.
Candlestick Reading for Beginners
Browse the lessons
The foundations
Reading a single candle
Reversal combinations
Momentum, continuation & breakouts
- Wick Reclaims: Read Bullish and Bearish Continuation5 min read
- Three-Candle Continuation: Identify the Next Push5 min read
- Three White Soldiers and Black Crows: Read the Direction5 min read
- Rising and Falling Three Methods: Spot Trend Continuation5 min read
- Breakout Candles: Identify Bullish and Bearish Breaks5 min read
The third candle establishes the reversal direction
A completed morning star after a decline is bullish. A completed evening star after a rise is bearish. Both show the existing move slowing, followed by a strong response in the opposite direction.
The small middle candle is only the pause. The third candle makes the pattern useful: it recovers or gives back enough of the first body to establish a reversal setup. At support, a morning star points toward a rebound. At resistance, an evening star points toward a downward pullback.
How to identify the three candles
Read three adjacent completed candles in order.
| Stage | Morning star | Evening star |
|---|---|---|
| 1: Existing pressure | Substantial red body after a decline | Substantial green body after an advance |
| 2: Pause | Small body near the low of the move | Small body near the high of the move |
| 3: Opposite response | Green close above the first body midpoint | Red close below the first body midpoint |
| Primary reading | Bullish reversal setup | Bearish reversal setup |
The middle candle can be green, red, or a doji. Its body should be noticeably smaller than the first; a small body with long wicks still has a wide total range. The first and third bodies do not need to be equal in length.
Traditional star patterns show body gaps around the middle candle, with some definitions differing on the second gap. On continuous-price charts, use an explicit no-gap morning-star or evening-star variant when that separation is absent.
Morning star: selling, pause, upward recovery
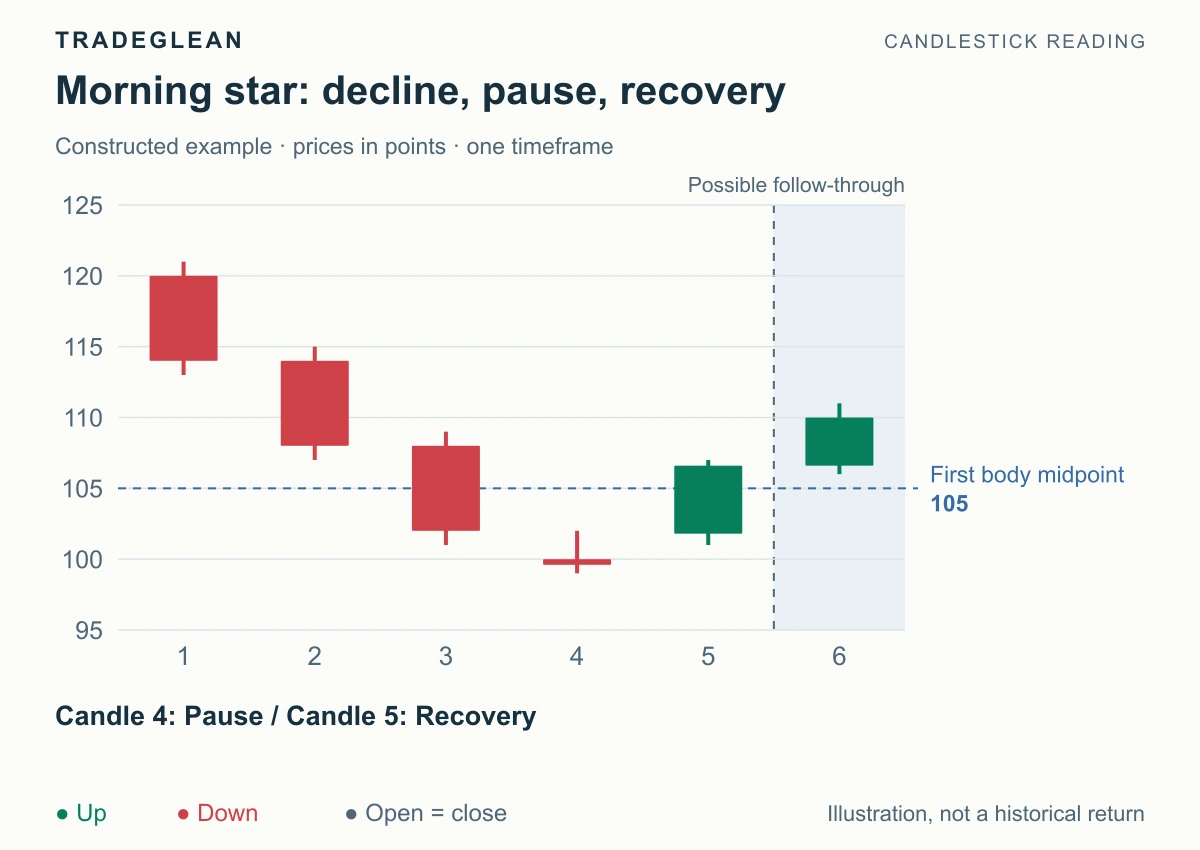
Constructed example in price points. Candles 3–5 form the pattern; candle 6 is later follow-through. Green candles close above their opens and red candles below.
Candle 3 falls from 108 to 102, making the body midpoint 105. Candle 4 opens at 100 and closes at 99.6. Its small body sits below the first body, showing that the decline has paused at a lower level.
Candle 5 opens at 101.8 and closes at 106.6, beyond the 105 midpoint. The three-candle morning star is now complete. The primary expectation is an upward recovery. The later advance in candle 6 supports that reading.
At the final close, mark the pattern's lowest low and nearest earlier resistance. An entry method might use the next available execution after completion, or wait for a break above the whole formation. Choose the method in advance; they give different entry prices.
A morning star ending a pullback within a larger uptrend is especially straightforward to interpret: it reverses the local decline in the direction of the larger trend. Check that the pullback has reached a support area rather than assuming every three-candle recovery is at a meaningful low.
Evening star: buying, pause, downward response
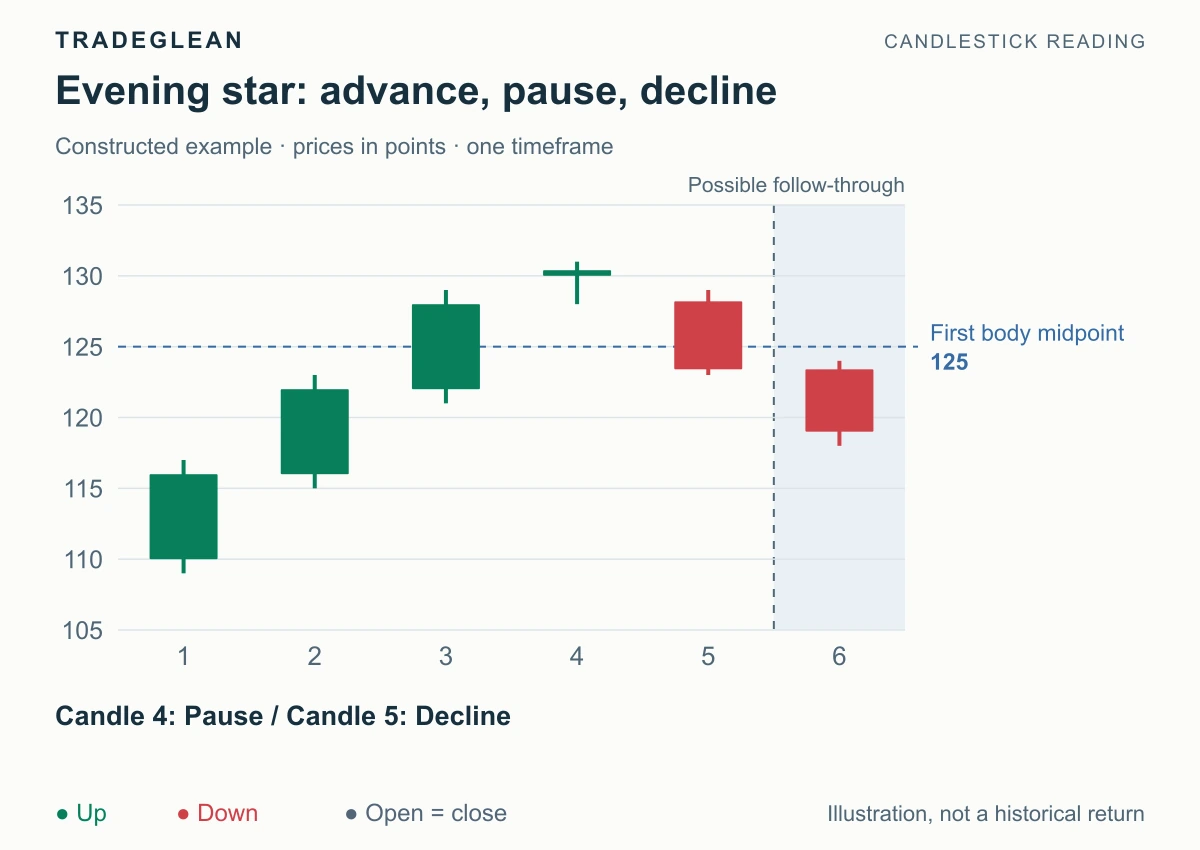
Candle 3 rises from 122 to 128; candle 5 closes at 123.4.
The first body midpoint is 125. Candle 4 opens at 130 and closes at 130.4, forming a small body above the preceding advance. Candle 5 then opens at 128.2 and closes at 123.4, below the midpoint.
Favor a downward pullback. The final red candle has already supplied a substantial bearish response, so this is more developed than an isolated doji at a high.
Look for the pattern at resistance after a rally. Earlier swing lows below it provide the first support references. A later close beneath the formation's low adds downside confirmation; recovery above the formation's high cancels a bearish plan based on that top holding.
On an hourly chart, this may be an hourly pullback rather than a reversal of the entire daily trend. State the timeframe so the forecast matches the pattern you are reading.
Recognize incomplete patterns
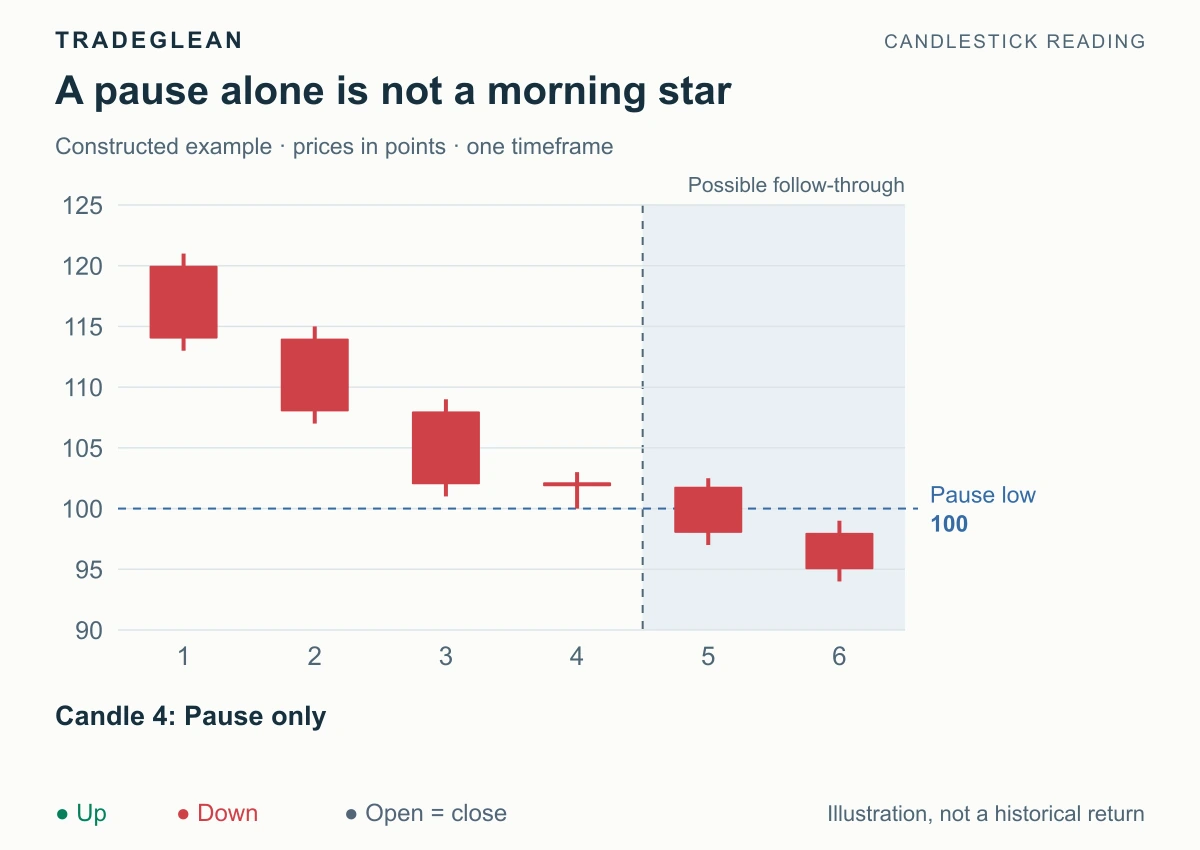
Candle 3 falls from 108 to 102. Candle 4 pauses near 102, but candle 5 closes at 98.
There is no morning star here. The third candle never makes the required upward response. The proper reading is bearish continuation after a pause. Calling the small middle candle a completed bullish reversal would miss the defining part of the pattern.
For a separate numerical check, a first red body from 120 to 110 has a midpoint of 115. A third green close at 114.8 is still short of the requirement. A wick above 115 does not substitute for the close.
Longer pauses should also be described clearly. Two or three small middle candles form a variation, not the exact three-candle example. An extended sideways period belongs under consolidation and breakouts.
Keep the main view and the failure condition together
For a morning star, favor recovery while the pattern low holds. For an evening star, favor decline while the pattern high holds. Those boundaries tell you when to abandon the original scenario.
Before entry, calculate the distance to the relevant boundary and the nearest obstacle in the expected direction. A setup can have a clear bullish or bearish message while requiring a better entry structure. The trading-plan guide explains that calculation.
Recognition check
After a decline, a large red candle is followed by a doji and then a green candle closing above the first body's midpoint. There are no body gaps. What should your note say?
Answer: A completed no-gap morning-star variant with a bullish recovery bias. Identify support, mark the formation low as the invalidation reference, and apply the entry rule you chose before the outcome.
References
StockCharts' Pattern Dictionary and IG's candlestick guide cover morning and evening stars. The numerical examples here are constructed for recognition and practice.