Hammer vs. Hanging Man: Identify the Shape and Direction
Recognize a hammer or hanging man from its body, lower wick, and trend position, then learn the bullish and bearish triggers for each setup.
Candlestick Reading for Beginners
Browse the lessons
The foundations
Reading a single candle
Reversal combinations
Momentum, continuation & breakouts
- Wick Reclaims: Read Bullish and Bearish Continuation5 min read
- Three-Candle Continuation: Identify the Next Push5 min read
- Three White Soldiers and Black Crows: Read the Direction5 min read
- Rising and Falling Three Methods: Spot Trend Continuation5 min read
- Breakout Candles: Identify Bullish and Bearish Breaks5 min read
A hammer points toward recovery; a hanging man warns of a decline
A hammer after a decline is a bullish reversal setup. A hanging man after a rise is a bearish reversal warning. They share the same outline, but the earlier move gives that outline its meaning.
With a hammer, focus on a rebound from the rejected low. With a hanging man, watch whether the market loses the recovered ground and starts moving lower. A later break in the expected direction gives the setup confirmation; the opposite extreme defines where the idea fails.
How to identify a hammer or hanging man
Look for one completed candle with these three features:
- A small, visible body near the top of the range.
- A lower wick at least roughly twice the body length.
- Little or no upper wick.
Then check the preceding move. After falling prices, use hammer. After rising prices, use hanging man. The body can be green or red in either case.
| Feature | Hammer | Hanging man |
|---|---|---|
| Appearance | Small body on top of a long lower wick | The same outline |
| Prior move | Decline or downward pullback | Advance or upward rally |
| Primary interpretation | Bullish reversal setup | Bearish reversal warning |
| Practical confirmation | Close above the candle high | Weakness below the body, then a close below the low |
| Setup invalidation | Break below the rejected low | Recovery above the signal high |
A lower wick alone is not enough. If the upper wick is also long, the candle does not have the clean top-heavy shape. If the body is almost absent, compare it with a dragonfly doji.
See a hammer and measure it
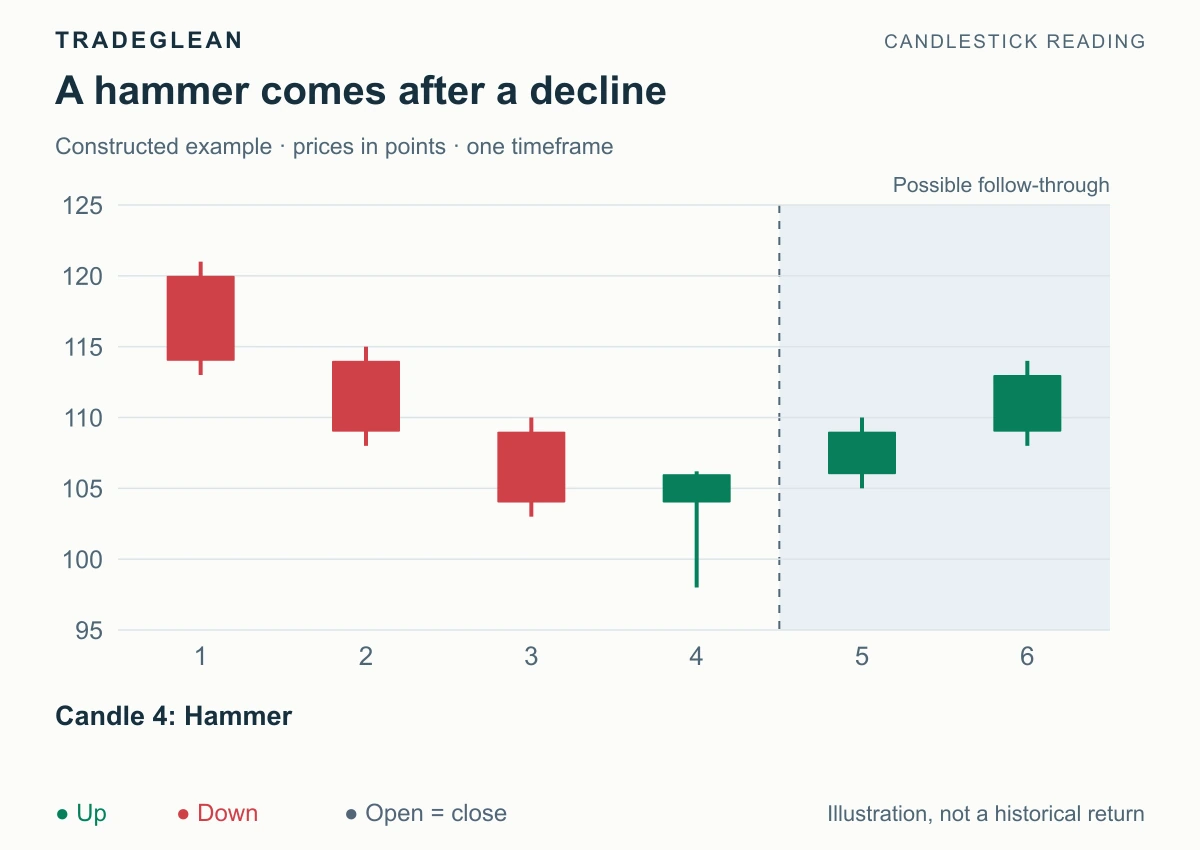
Constructed prices on one timeframe. Green candles close above their opens and red candles below. The signal is candle 4; later candles start at 5.
Candle 4 opens at 104, reaches 106.2, falls to 98, and closes at 106. The body is 2 points, the lower wick is 6, and the upper wick is just 0.2. Its lower wick is three times its body.
After the preceding decline, the close near the top shows that the attempt to push lower was rejected. The working view is bullish recovery. The signal high at 106.2 is the next boundary to watch, and the rejected low at 98 is the invalidation reference.
Candle 5 closes at 109, above 106.2. That confirms upward follow-through under the closing rule used here. On a full chart, look for this behavior at prior support or at the end of a pullback within a larger uptrend. Those locations give the recovery a clearer structural reason.
For a new entry, mark the next resistance before calculating size. A bullish reading remains useful even when a late entry leaves too little room; you can watch for a subsequent higher low instead of chasing the confirmation candle.
Why the hanging man is a bearish warning
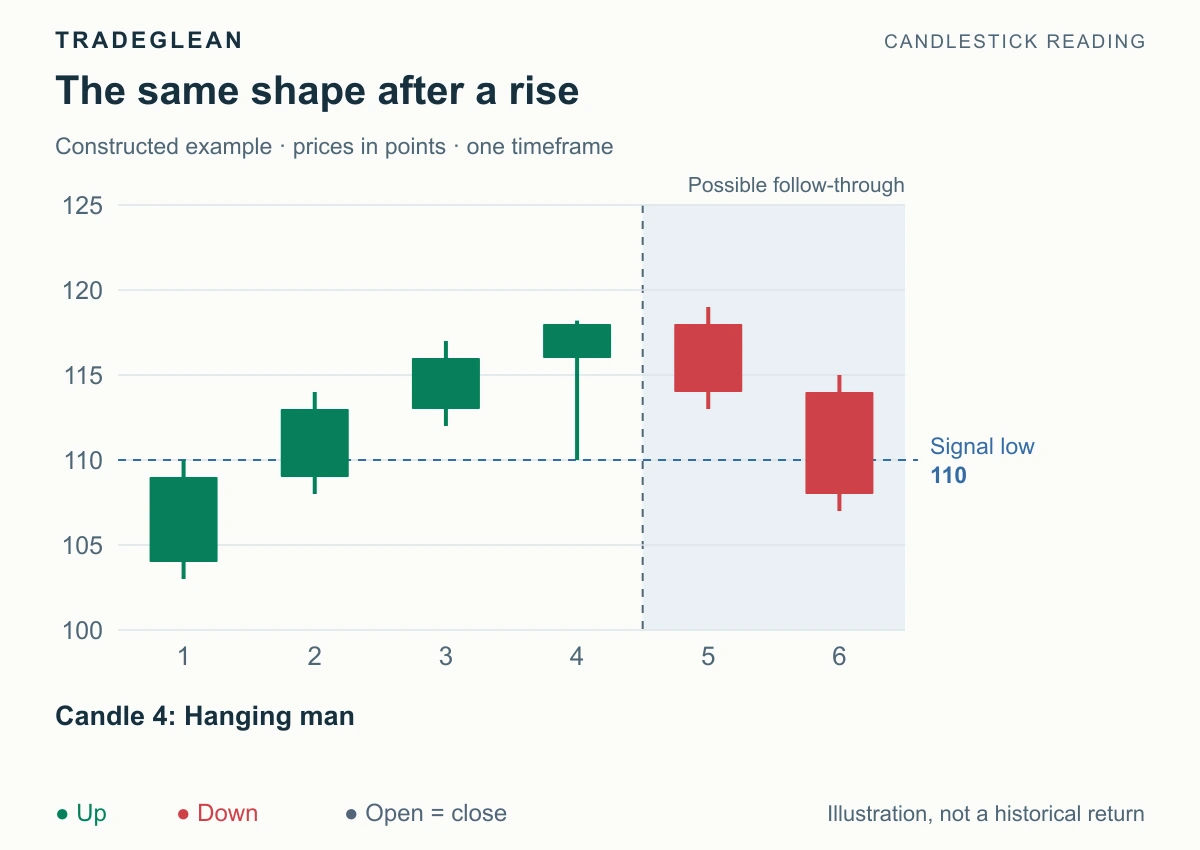
Candle 4 opens at 116, reaches 118.2, falls to 110, and closes at 118.
The market has been rising, but the hanging man contains a sizable downward excursion. Its close recovers, so the candle by itself is an early warning. The direction to watch is downward, with later weakness needed to show that the advance is giving way.
Candle 5 closes at 114, below the hanging man's 116–118 body. That is the first bearish follow-through. Candle 6 closes at 108, below the complete signal low of 110, giving a stronger downside confirmation.
These are different stages. An early-entry method using a body break and a later method using a low break will have different entries and risk distances. For beginner replay, choose the full-low closing break and apply it consistently.
At resistance after an extended rise, this sequence is a reason to prepare for a pullback and review protection on an existing long position. It does not call for treating the long lower wick as another buy signal.
Invalidation: the high is reclaimed
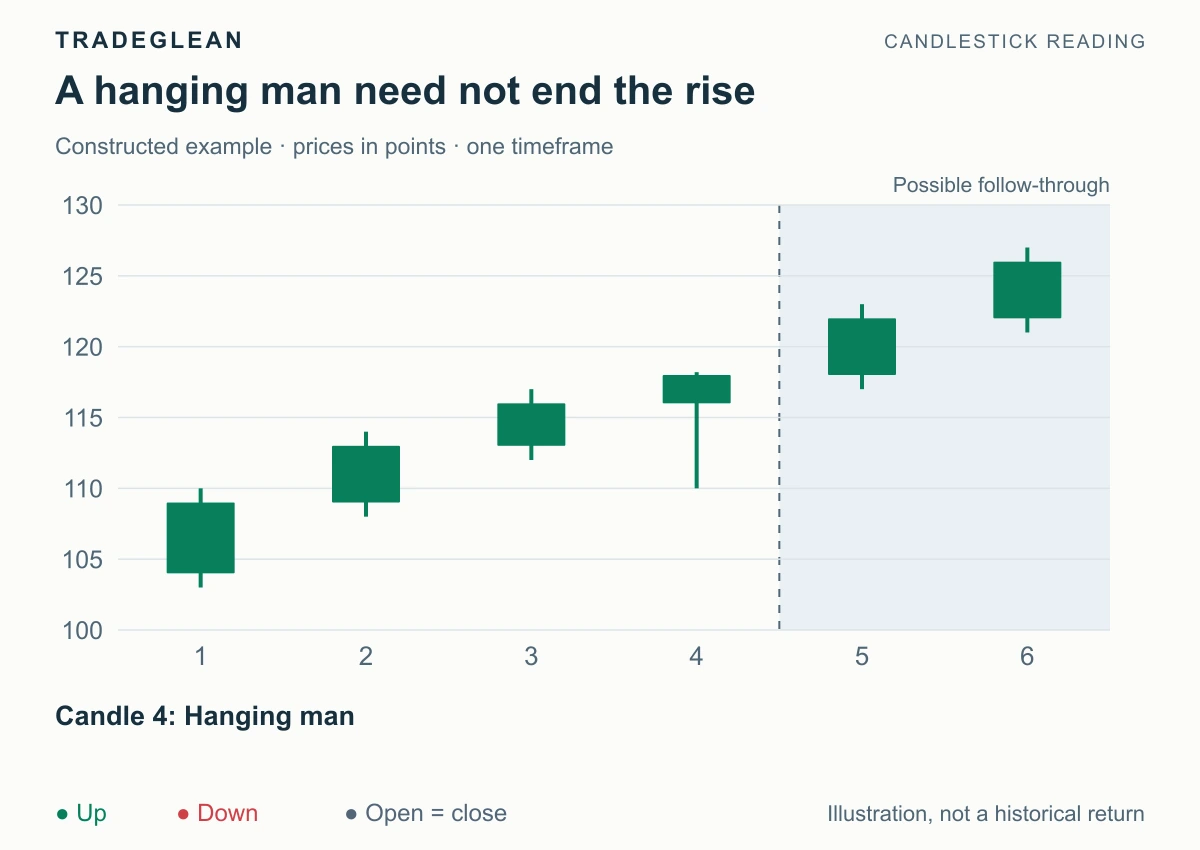
The bearish warning does not develop into a downward break. Price resumes the advance.
Once price takes back 118.2, drop the rejection-based bearish idea. The opposite applies to a hammer: a break below its lower wick cancels a recovery plan built on that low holding.
An unfilled setup that gets canceled is different from a filled trade that hits its stop. Keep that distinction in your notes without changing the original candle's name after the outcome.
Check the shape and the direction together
A red candle appears after a decline. Its body is 2 points, its lower wick is 6, and its upper wick is 5. Is it a clear hammer?
Answer: No. The long upper wick fails the shape check. Red would be acceptable, but the body needs to sit close to the top. A clear hammer at support would favor a bullish recovery, with a closing break above its high as the trigger used here.
Next, turn the dominant wick upward to compare shooting stars and inverted hammers.
References
StockCharts: Hammer and Hanging Man and IG: Candlestick Patterns give the traditional shape and trend distinctions. The examples illustrate their use without assigning a statistical win rate.