Bullish or Bearish? Put Candlestick Signals in Context
Choose a bullish or bearish bias from the trend, signal location, and completed pattern, then define the trigger and the price that changes your view.
Candlestick Reading for Beginners
Browse the lessons
The foundations
Reading a single candle
Reversal combinations
Momentum, continuation & breakouts
- Wick Reclaims: Read Bullish and Bearish Continuation5 min read
- Three-Candle Continuation: Identify the Next Push5 min read
- Three White Soldiers and Black Crows: Read the Direction5 min read
- Rising and Falling Three Methods: Spot Trend Continuation5 min read
- Breakout Candles: Identify Bullish and Bearish Breaks5 min read
Build a bullish or bearish view
A useful candlestick reading should tell you which move to prepare for. A bullish reversal at support points you toward a recovery. A bearish rejection at resistance points you toward a decline. A continuation pattern directs attention back to the existing trend.
Start with trend → location → signal → trigger → invalidation. The signal establishes the direction you are watching. The trigger is the additional price condition your plan requires before acting. Invalidation tells you when the original idea no longer fits.
You can favor a direction while waiting for an entry. “Bearish setup; waiting for a break of the signal low” is a clear conclusion.
Let the trend provide the starting bias
An uptrend has rising swing highs and rising swing lows. A downtrend has falling swing highs and lows. In a range, price repeatedly trades between boundaries without sustained progress.
Use the current trend as your starting point. In an uptrend, look first for bullish signals at pullback support. In a downtrend, look first for bearish signals after rallies into resistance. An opposing signal deserves more attention when it forms at a clear boundary and begins to break the existing structure.
Choose the timeframe before doing this. An hourly decline can be a pullback within a daily uptrend. A bullish hourly reversal then describes a recovery from that pullback; it need not mean a new long-term trend has begun.
Match the signal to a location
Mark support and resistance from earlier swing points or repeated range edges. They should already have an explanation before the new candle appears.
| Setup | Primary reading | What to watch next |
|---|---|---|
| Hammer or dragonfly after a decline into support | Bullish reversal setup | A close above the signal high |
| Shooting star or gravestone after a rise into resistance | Bearish reversal setup | A close below the signal low |
| Bullish engulfing or morning star at the end of a pullback | Bullish recovery | Holding the pattern low and breaking nearby resistance |
| Bearish engulfing or evening star after a rally | Bearish reversal setup | Lower closes and a break of nearby support |
| Completed continuation pattern within a trend | Continuation in that trend's direction | Holding the pullback boundary |
| Two-sided doji in the middle of an overlapping range | No standalone directional setup | A meaningful boundary break |
The final row is a filtering decision. You do not need to give every candle a bullish or bearish forecast to make the qualifying signals useful.
Read an upper-wick rejection as a bearish setup first
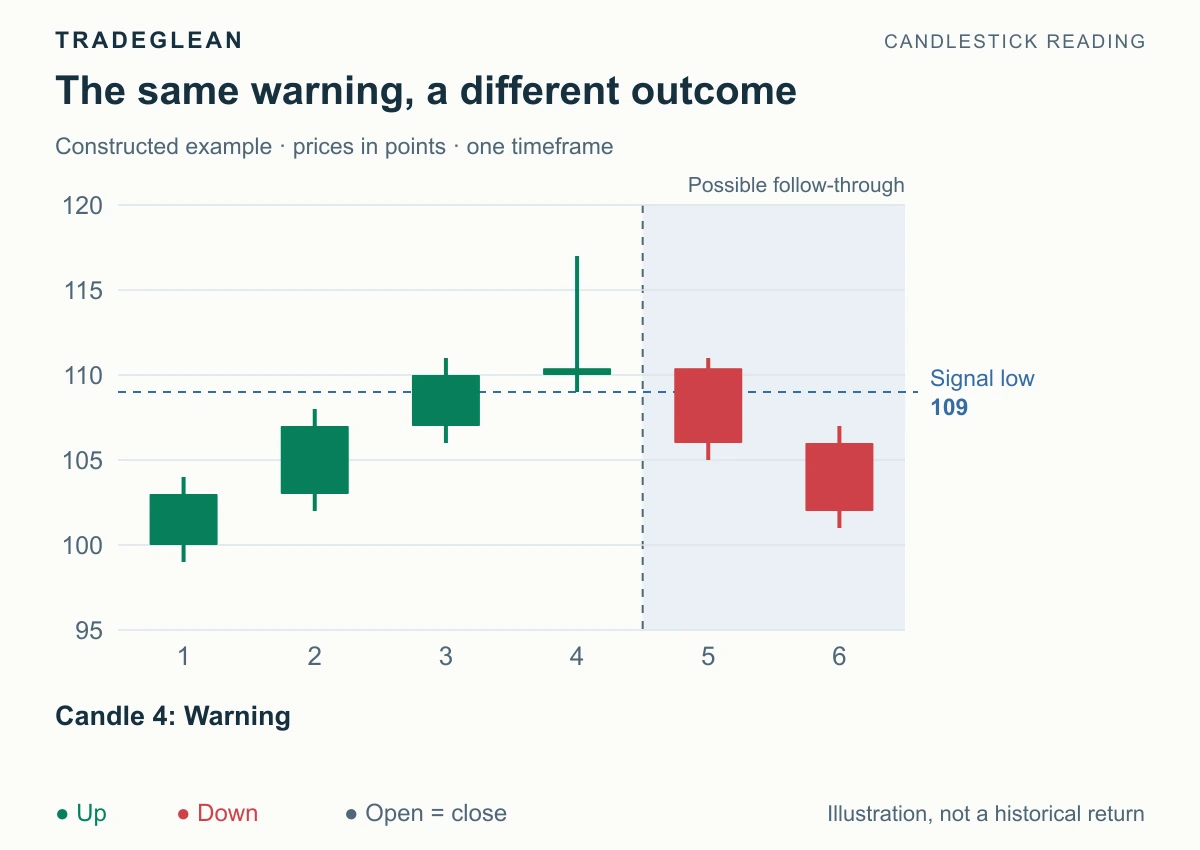
Constructed example in price points. Candle 4 is the signal; candles 5 and 6 are later information. Green candles close above their opens and red candles below.
Price has been rising. Candle 4 reaches 117 but closes at 110.4, near its open of 110. Its low is 109. The long upper wick shows that the upward extension was given back by the close.
The initial reading is bearish: prepare for a pullback rather than chasing the rise. On a full chart, give this setup priority when the wick tests a resistance area marked beforehand. This cropped illustration shows the local rise; it does not supply a longer history of resistance.
A closing break below 109 is the confirmation condition in this example. Candle 5 closes at 106, so the bearish setup gains downside confirmation. Candle 6 continues lower. The expected move was defined before those later candles appeared.
For a practice note, write: “Bearish upper-wick rejection after a rise. Watch below 109; the rejection is invalidated above 117.” These are chart levels, not assumed order fills.
Use the other outcome to define failure
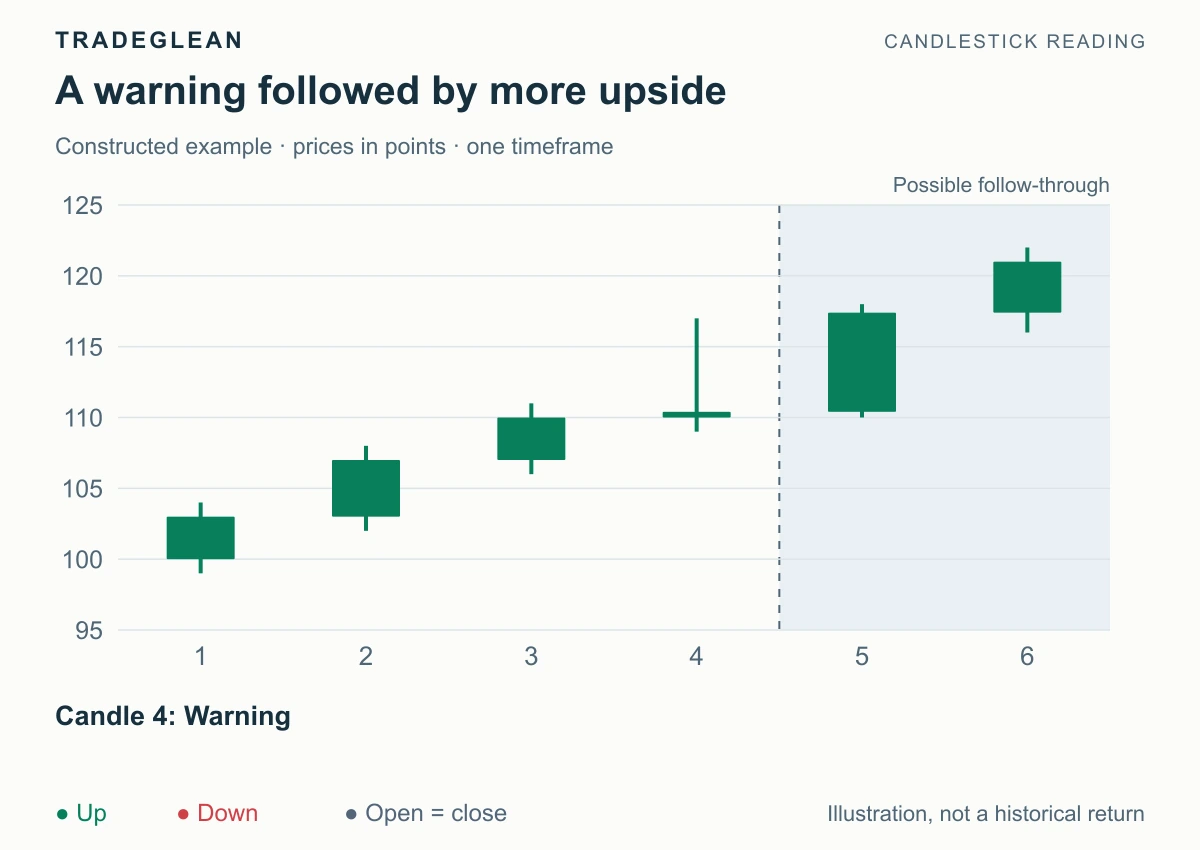
The first four candles are unchanged. Candle 5 closes at 117.4, above the signal high.
Here the bearish setup fails to develop. Price takes back the rejected area, so the original short-side idea should be dropped. With renewed higher closes, the broader uptrend again becomes the relevant direction.
This does not make the original signal meaningless. It gives the reading an expiry: bearish below the rejection high, canceled when that high is reclaimed. You are following a defined scenario and responding to evidence.
Separate direction from entry quality
A bullish setup can be clear while the available entry is too close to resistance. Suppose a long entry reference is 105, the stop reference is 100, and the nearest resistance is 108. The risk distance is 5 points and the space is 3, or 0.6R, where R is initial risk.
That may fail the space requirement of your chosen method. Keep the conclusion precise: bullish view, poor entry at this price. A subsequent pullback and higher low could create a new entry structure; use the levels that actually form rather than inventing a tighter stop.
Likewise, confirmation should be specific. A close beyond a level, an intrabar crossing, and a successful retest are different entry conditions. Choose one before reviewing the outcome.
Write one useful sentence
Use this format: “I favor [direction] because [pattern at location]. I am watching [trigger]. I will drop the idea if [invalidation].”
For the main chart: “I favor a downward pullback because the rise ended in an upper-wick rejection. I am watching for a close below 109. A recovery above 117 cancels the rejection setup.”
Throughout this collection, a directional bias means the scenario favored by the stated chart conditions. It is not a percentage estimate. A win rate requires a defined market, timeframe, entry, exit, and a tested sample.
Further reading
Fidelity: Support and Resistance explains prior price areas. StockCharts: Bearish Reversal Patterns provides the traditional bearish classifications.