Piercing Pattern and Dark Cloud Cover: Read the Reversal
Recognize these two-candle reversal signals using the body midpoint, then apply a bullish piercing pattern or bearish dark cloud cover at the right level.
Candlestick Reading for Beginners
Browse the lessons
The foundations
Reading a single candle
Reversal combinations
Momentum, continuation & breakouts
- Wick Reclaims: Read Bullish and Bearish Continuation5 min read
- Three-Candle Continuation: Identify the Next Push5 min read
- Three White Soldiers and Black Crows: Read the Direction5 min read
- Rising and Falling Three Methods: Spot Trend Continuation5 min read
- Breakout Candles: Identify Bullish and Bearish Breaks5 min read
More than halfway back gives the pair its direction
A piercing pattern after a decline is a bullish reversal setup. Its green second candle recovers more than half of the preceding red body. Dark cloud cover after an advance is bearish: the red second candle gives back more than half of the preceding green body.
The useful question is whether the previous move is starting to lose control at support or resistance. Start with that directional reading, then check the midpoint and opening relationship to confirm the pattern you are seeing.
How to identify the two-candle pattern
Each uses two completed candles with substantial bodies relative to nearby candles.
| Check | Piercing pattern | Dark cloud cover |
|---|---|---|
| Preceding move | Decline | Advance |
| First candle | Red | Green |
| Second candle | Green | Red |
| Strict opening condition used here | Below the first candle's low | Above the first candle's high |
| Required second close | Above the first body midpoint, but below its open | Below the first body midpoint, but above its open |
| Main reading | Bullish reversal | Bearish reversal |
Calculate the midpoint from the open and close:
Body midpoint = (first open + first close) ÷ 2.
A candle opening at 110 and closing at 102 has a body midpoint of 106. Its high and low are not part of this calculation. The second candle must close beyond the midpoint; merely reaching it with a wick is insufficient.
Piercing pattern: buyers recover the prior loss
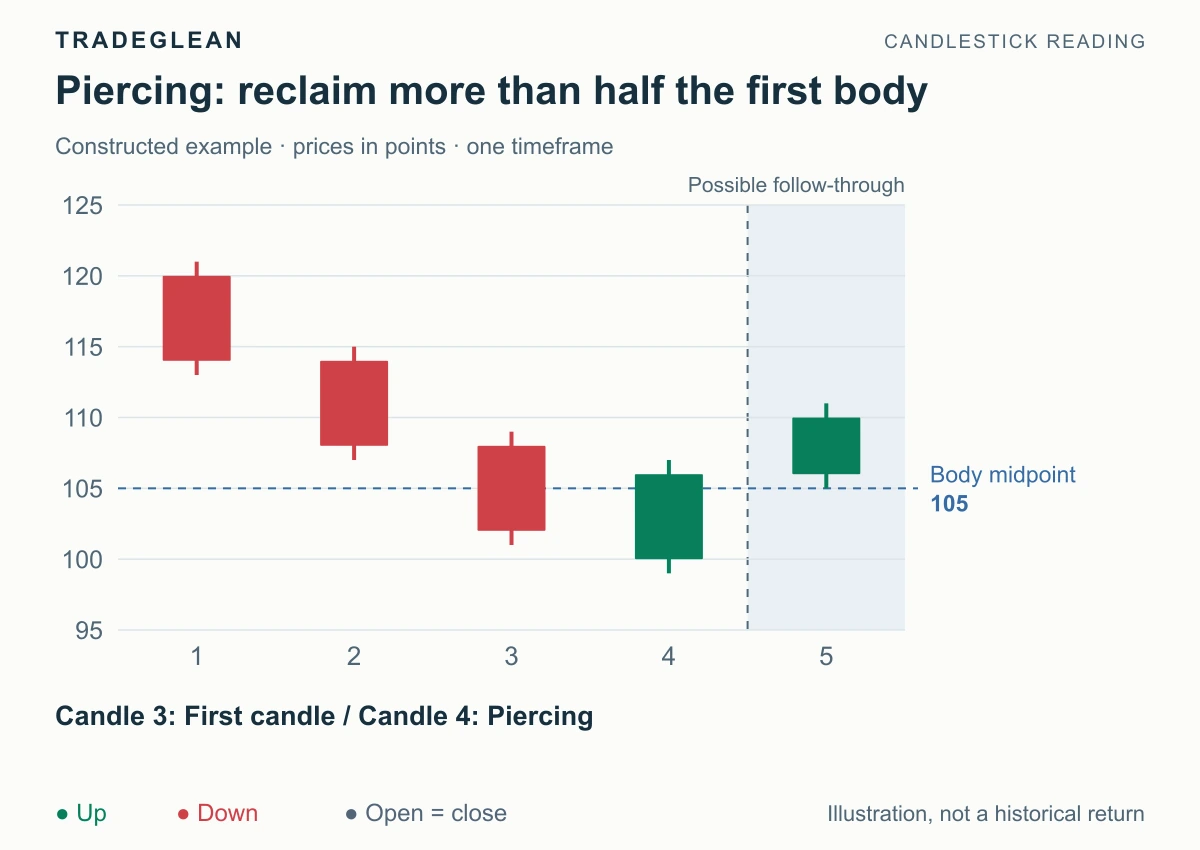
Constructed example using equal periods and price points. Green means close above open, red means below. Candles 3 and 4 form the pair.
Candle 3 falls from 108 to 102. The body midpoint is 105, and the low is 101. Candle 4 opens at 100, below that low, but closes at 106.
The close has recovered more than half of the preceding body while remaining below its open of 108. That is the piercing relationship. Favor an upward recovery, particularly when this sequence tests an established support area.
The second candle contains the reversal response; later strength above the pair's high supplies further confirmation. The combined low is the boundary for a recovery plan built on support holding. Earlier highs above the pair are the next places where the recovery may meet resistance.
For practice, mark those levels when candle 4 closes. You should be able to say where upward progress would confirm the reading and where a lower break would cancel it.
Dark cloud cover: sellers give back the advance
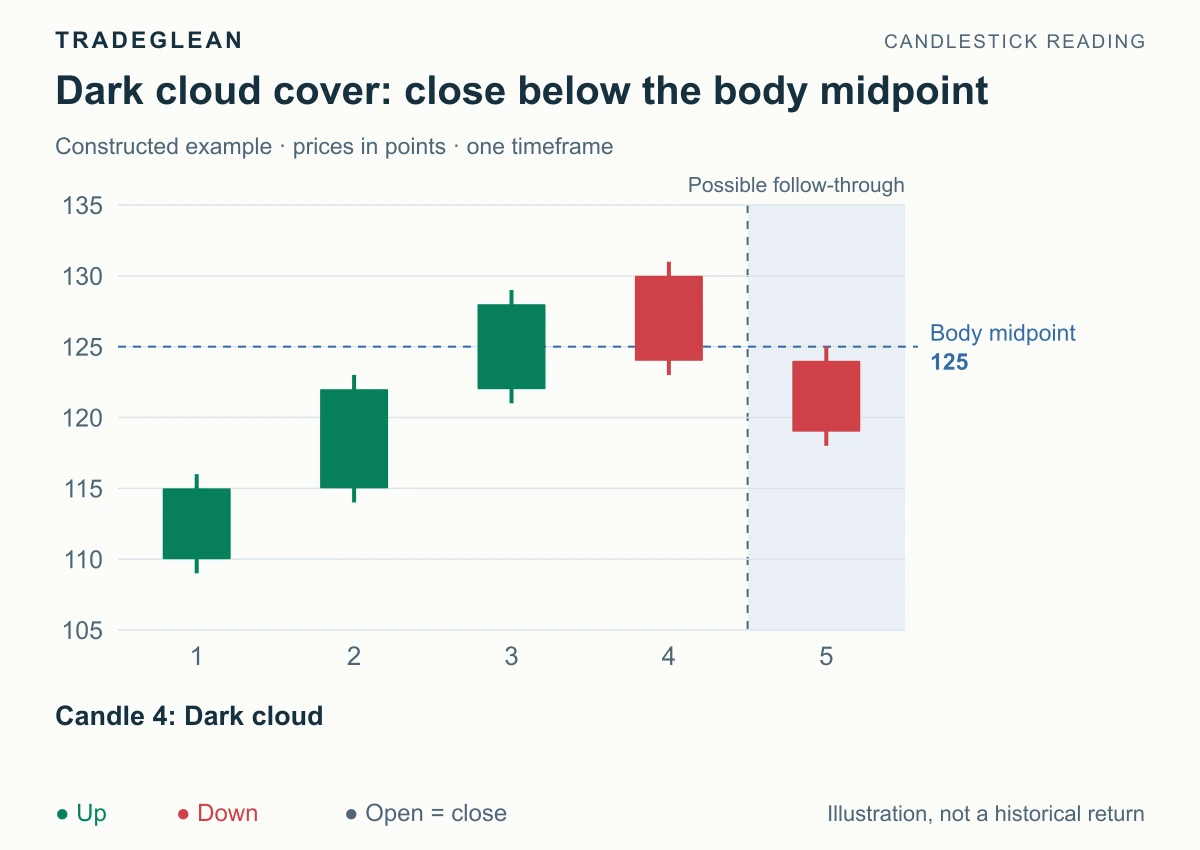
Candle 3 rises from 122 to 128. Candle 4 opens at 130 and closes at 124.
The first body midpoint is 125 and its high is 129. The second candle opens above that high, then closes below 125 while remaining above the first open at 122.
This is a failed extension of the rise followed by a substantial downward close. The working view is bearish, with particular relevance near previously marked resistance.
A closing break below the pair's low confirms downward follow-through in this walkthrough. A recovery above the pair's high invalidates the rejection-based idea. Check the nearest support before treating the signal as a new short-side opportunity.
Recognize the no-gap version without changing the price facts
On forex, crypto, or other continuously quoted charts, a new candle often opens near the previous close. You may see the same midpoint recovery without the opening gap.
After a red body from 108 to 102, a green body from 102 to 106 is a no-gap midpoint recovery. After a green body from 122 to 128, a red body from 128 to 124 is a no-gap midpoint decline. At appropriate support or resistance, the directional readings remain bullish recovery and bearish rejection respectively.
Label these as no-gap variants. Definitions vary: some published piercing descriptions require an open below the prior close, while stricter versions require below the prior low. The examples above use the stricter rule so a reader can reproduce the identification exactly.
Near-miss: the second close stops short
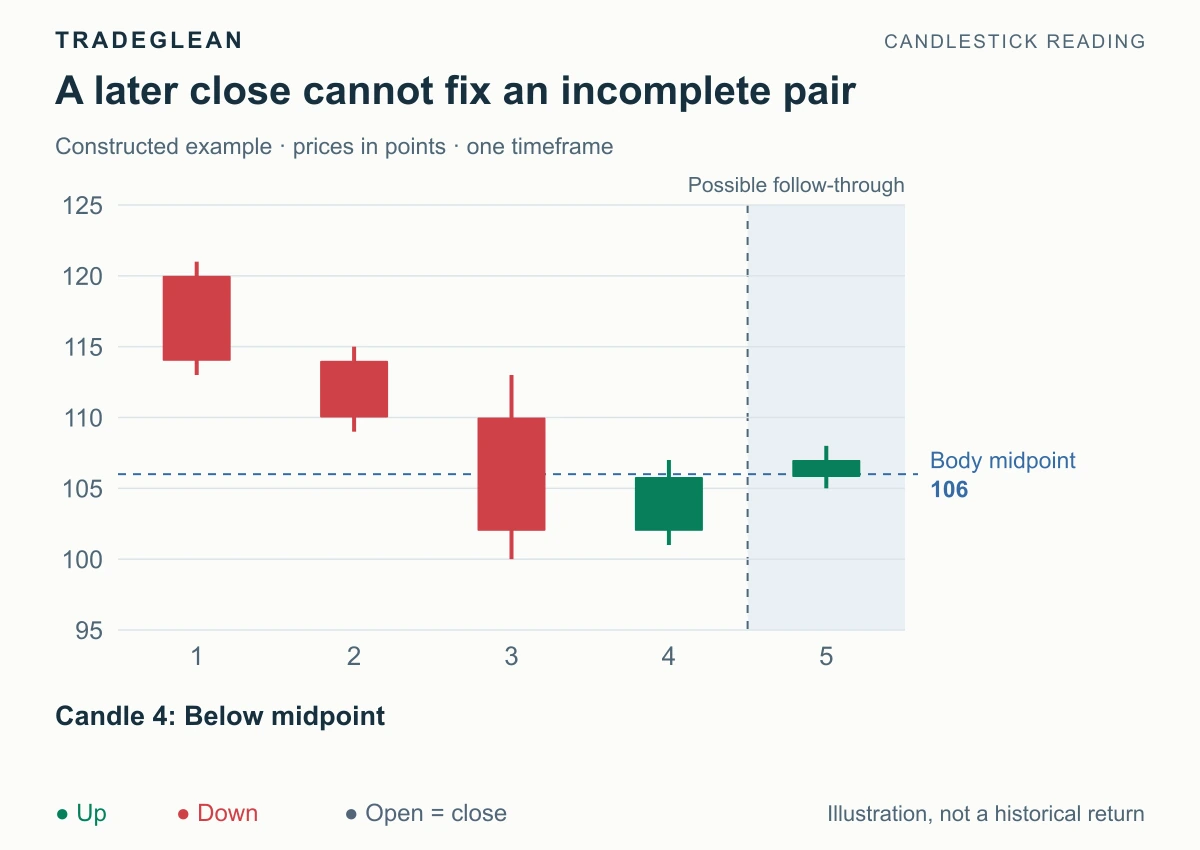
Candle 3 opens at 110 and closes at 102. Candle 4 reaches 107 but closes at 105.8.
This candle does not complete the midpoint recovery. Its wick went beyond 106, but its close did not. A later close at 107 supplies new information; it cannot turn this earlier two-candle pair into a completed piercing pattern.
A close exactly at the midpoint also fails the beyond-halfway rule used here. If the second body instead covers the first body completely, compare the result with engulfing.
Put the signal into a plan
Keep the primary expectation and the failure boundary together: piercing at support, favor recovery while the low holds; dark cloud at resistance, favor decline while the high holds. Then choose one entry method, such as a closing break beyond the pair, and calculate its stop distance and nearest obstacle.
A midpoint signal is useful because it identifies which side is taking back ground. Entry timing still matters: a long confirmation candle can leave you too far from the structural stop. Wait for a new entry structure if the space no longer suits the plan.
Recognition check
A green candle opens at 100 and closes at 108. The next red candle opens at 108 and closes at 103 after a rally into resistance. What has formed?
Answer: A bearish no-gap midpoint-decline variant. The midpoint is 104, so the second close passes the depth test, but there was no gap above the first high. Watch the pair's low for downward confirmation and its high for invalidation.
References
StockCharts' Pattern Dictionary, Bullish Reversal Patterns, and Bearish Reversal Patterns describe the midpoint and gap conventions. All figures are illustrative.