Hammer vs. Shooting Star: Wick, Trend, and Confirmation
Compare a hammer and shooting star with measured candle examples. Learn which wick matters, how the prior move changes the name, and why color alone is insufficient.
In brief
- Main difference
- Hammer: lower wick after a decline. Shooting star: upper wick after a rise.
- Body color
- Either can close above or below its open; color does not decide the name.
- Method shown here
- Wait for a close above the hammer high or below the shooting-star low.
- Cancel when
- Before confirmation, price crosses the opposite signal extreme.
- Next decision
- Check the next support or resistance and the distance to your protective stop.
Before you read · terms and starting articles
New to a term? Open the trading glossary.
In this article
The difference between a hammer and a shooting star
A hammer has a long lower wick, a small body near the top, and appears after a decline. A shooting star has a long upper wick, a small body near the bottom, and appears after a rise. The hammer suggests a possible recovery; the shooting star warns of a possible decline. Neither promises a reversal. These are the conventional distinctions described by StockCharts ChartSchool.
Start with the wick and the preceding move. A green body does not automatically make the candle a hammer, and a red body does not automatically make it a shooting star.
| Check | Hammer | Shooting star |
|---|---|---|
| Dominant wick | Below the body | Above the body |
| Body position | Near the top of the candle | Near the bottom of the candle |
| Preceding move | Decline or downward swing | Rise or upward swing |
| Interpretation | Potential bullish reversal | Potential bearish reversal |
| Confirmation method in this article | Later close above the signal high | Later close below the signal low |
| Cancellation before confirmation | Price falls below the signal low | Price rises above the signal high |
The confirmation and cancellation rows describe the specific method used in our examples. They are not universal definitions of these patterns. Other methods use different follow-through or entry conditions.
Measure the wick instead of guessing from color
For either candle, calculate the three parts from its open, high, low, and close:
- Body: the absolute difference between the open and close.
- Upper wick: high minus the higher of open and close.
- Lower wick: the lower of open and close minus low.
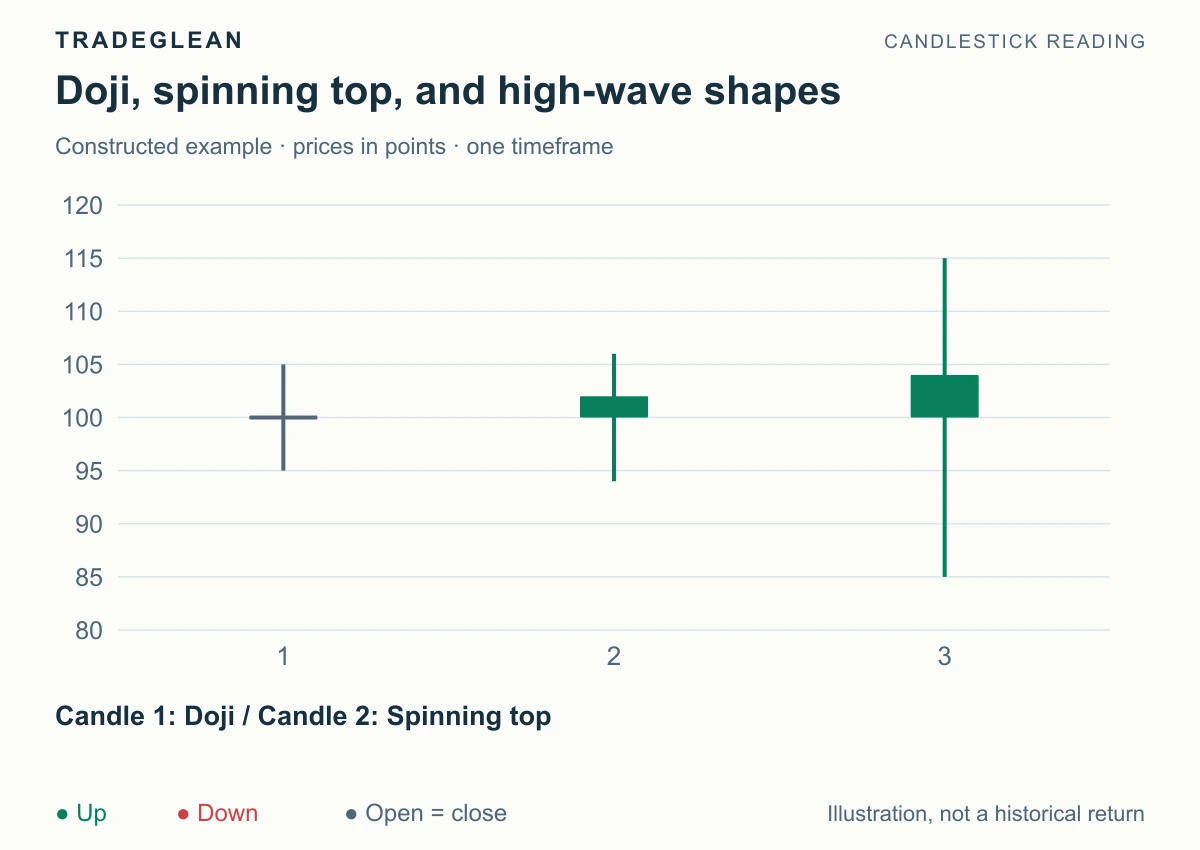
A common visual guideline is a dominant wick at least about twice the body, with a short or absent opposite wick. A nearly zero body needs separate consideration as a doji. The candle-reading guide explains the four prices and chart color conventions.
Here are the two signal candles used below. Prices are constructed points on one timeframe, not historical market data.
| Measurement | Red hammer | Green shooting star |
|---|---|---|
| Open | 200 | 147 |
| High | 200.2 | 155 |
| Low | 192 | 146.8 |
| Close | 198 | 149 |
| Body | 2 | 2 |
| Upper wick | 0.2 | 6 |
| Lower wick | 6 | 0.2 |
| Dominant wick / body | 3 | 3 |
Both candles have the same body and dominant-wick lengths. Their wick directions, prior moves, and subsequent conditions differ. OHLC also cannot establish the full sequence of moves within either candle.
Hammer example: a red body can still be a recovery setup
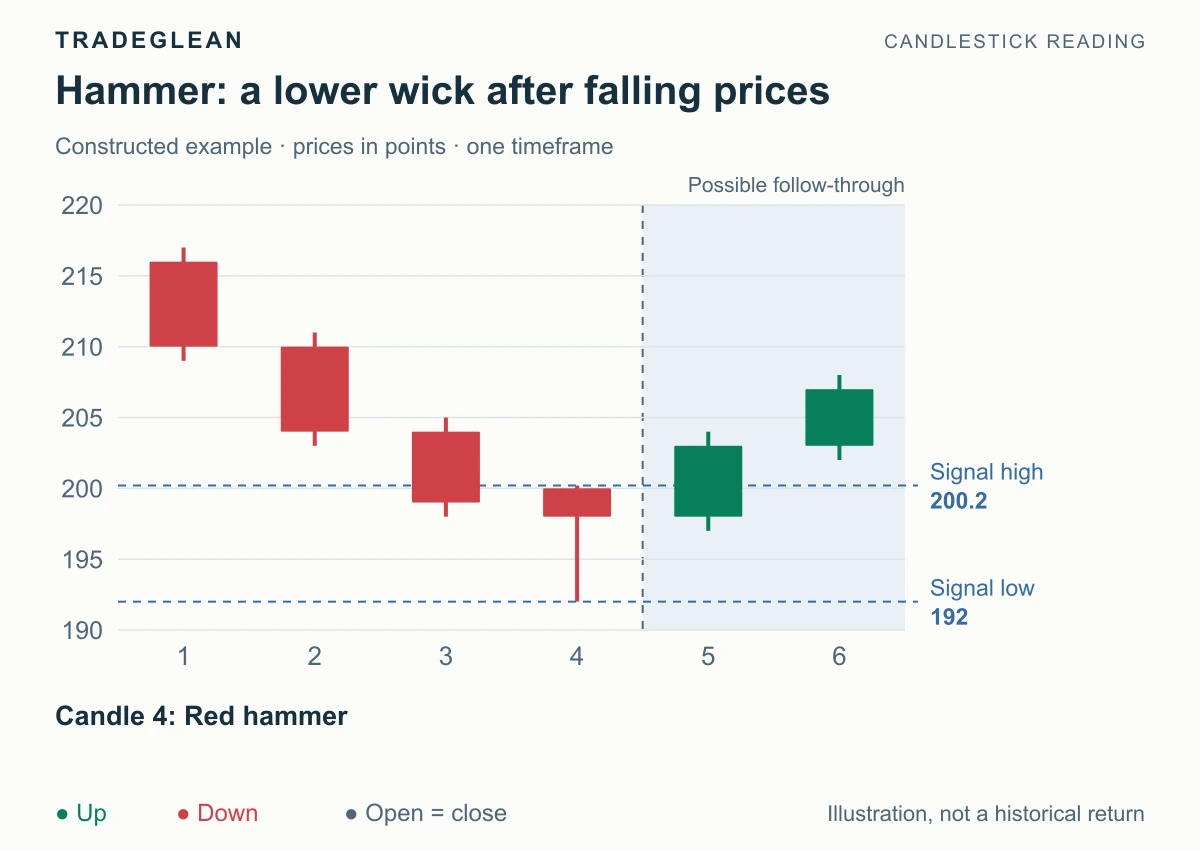
Constructed example. The signal is candle 4. The shaded area begins at candle 5 and shows one possible outcome. Green means close above open; red means close below open.
The first three candles close at 210, 204, and 199. Candle 4 then trades as low as 192 and finishes at 198. Its close is below its 200 open, making the body red, but the close is well above the low. The body sits near the top of its 192–200.2 range.
Measure the lower wick as 198 minus 192: 6 points. The body is 200 minus 198: 2 points. The 0.2-point upper wick is small. After the falling sequence, this is a hammer candidate with a possible recovery interpretation.
For the closing-confirmation method, mark 200.2 as the upward boundary. Candle 5 opens at 198, reaches 204, and closes at 203. Its low is 197, so it stays above the 192 cancellation level and closes above the signal high. This meets the stated confirmation condition. Candle 6 closes at 207, illustrating further strength.
The later candles are an authored scenario. They do not establish how often hammers work. If price had crossed below 192 before the upward confirmation, this particular recovery setup would have been canceled.
On a full chart, examine the surrounding support and resistance. A six-candle illustration does not establish a major support level or a reversal of the larger trend.
Shooting-star example: a green body can still warn of weakness
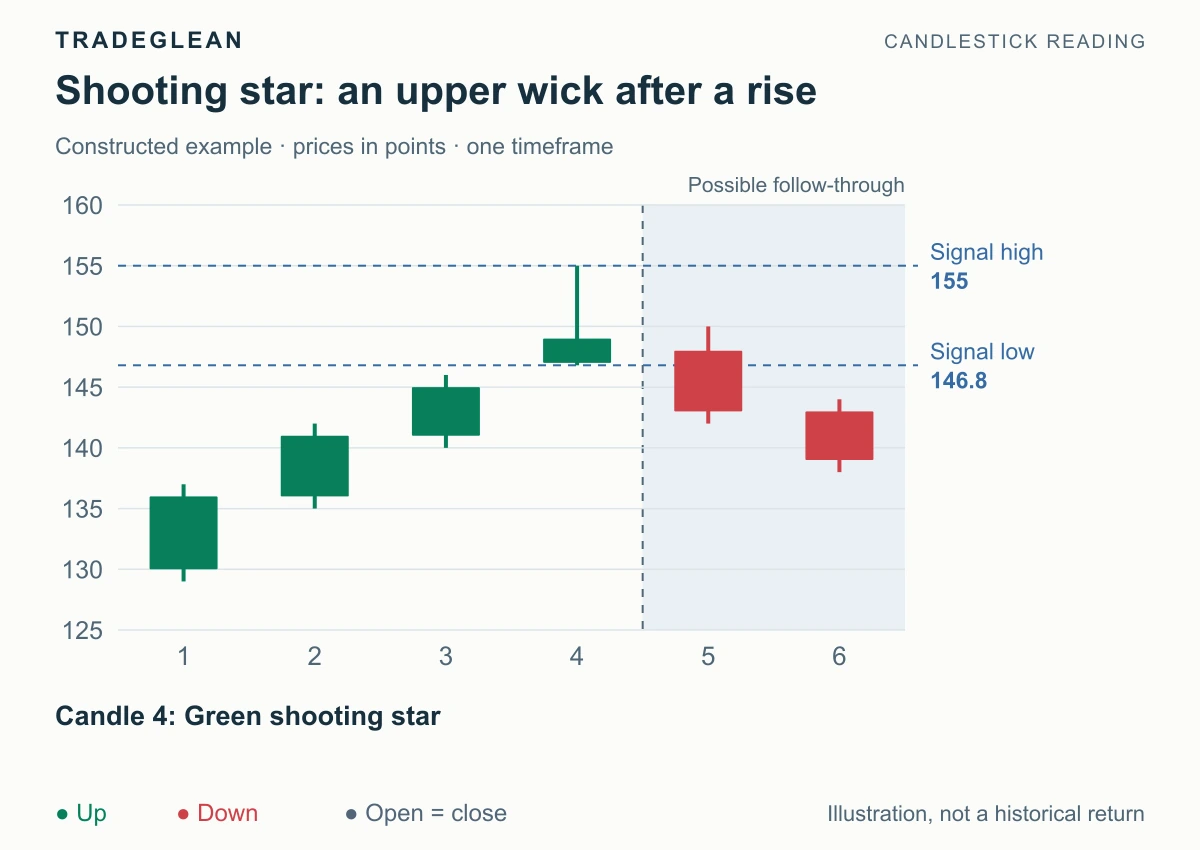
Constructed example. Candle 4 has a long upper wick and a body above the preceding candle's body. Possible bearish follow-through starts at candle 5.
The first three closes rise from 136 to 141 to 145. Candle 4 opens at 147, reaches 155, and closes at 149. It has a green body because 149 is above 147. Its upper wick is nevertheless 155 minus 149 = 6 points, while the body is 149 minus 147 = 2 points. The low of 146.8 leaves only a 0.2-point lower wick.
This candle finishes near the bottom of its range after an upward swing. The body also gaps above the preceding body, which ended at 145. Traditional descriptions include this star position; some charting methods also recognize the rejection shape without an opening gap. StockCharts explains that distinction.
Under our closing method, the bearish boundary is 146.8. Candle 5 opens at 148, reaches a high of 150, and closes at 143. Its high remains below the 155 cancellation level, while its close is below the signal low. Candle 6 closes at 139. This is one possible confirmed downward sequence, even though the signal body was green.
A shooting star can fail before any bearish confirmation
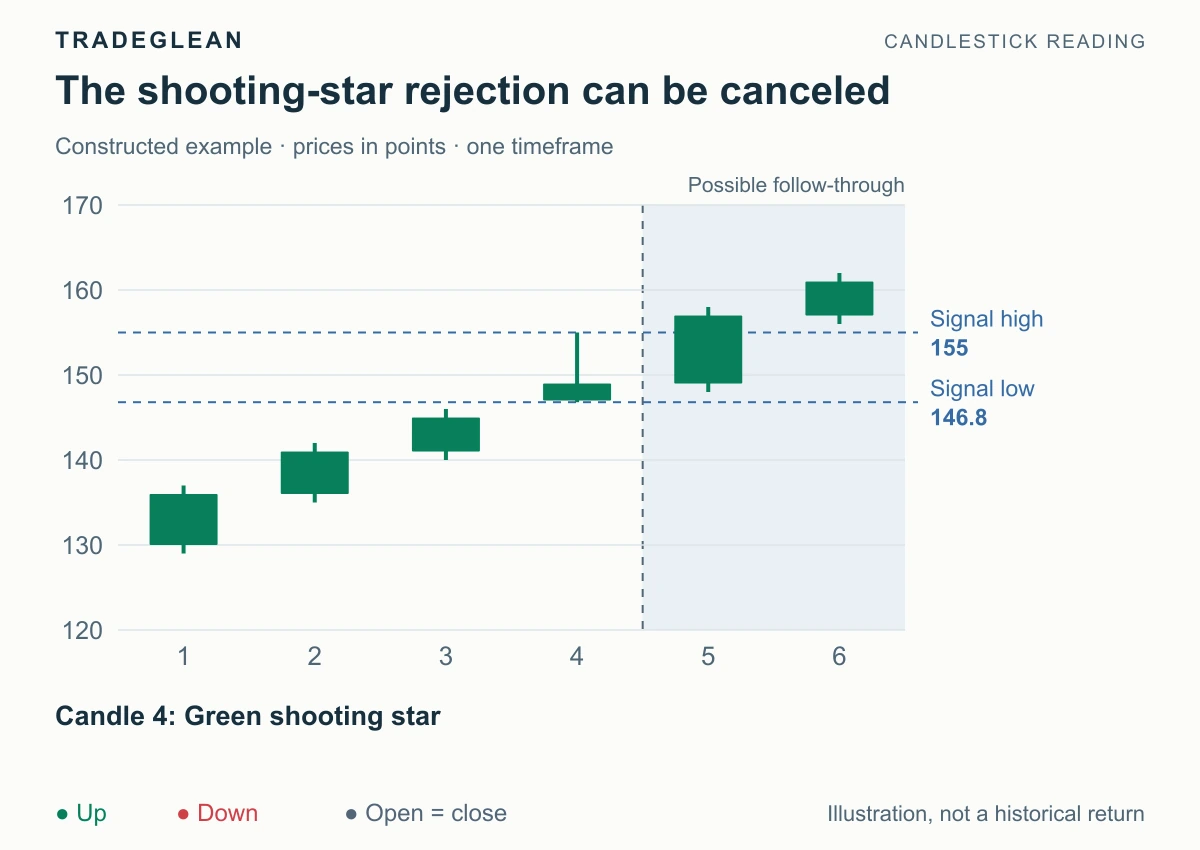
An alternative constructed outcome using the same first four candles. Candle 5 reaches 158 and closes at 157 instead of falling below the signal low.
Here, candle 5 has a low of 148, so no downward break of 146.8 occurs. It rises through 155 and closes at 157. The rejection-based bearish setup is canceled; the long upper wick did not end the advance.
A closing-confirmation rule is also different from an intrabar entry rule. A wick below 146.8 followed by a close back above it would not meet the method shown here. If an actual position has a protective stop, that stop can trigger during the candle. Keep setup review rules, order triggers, and actual fills separate; the trading-plan guide connects those decisions.
Is a shooting star the opposite of a hammer?
It is a useful comparison of opposite wick directions and conventional reversal interpretations. It does not mean every upper-wick candle is a shooting star or every lower-wick candle is a hammer. Use this four-pattern map:
| Wick direction | After a decline | After a rise |
|---|---|---|
| Long lower wick, body near the top | Hammer | Hanging man |
| Long upper wick, body near the bottom | Inverted hammer | Shooting star |
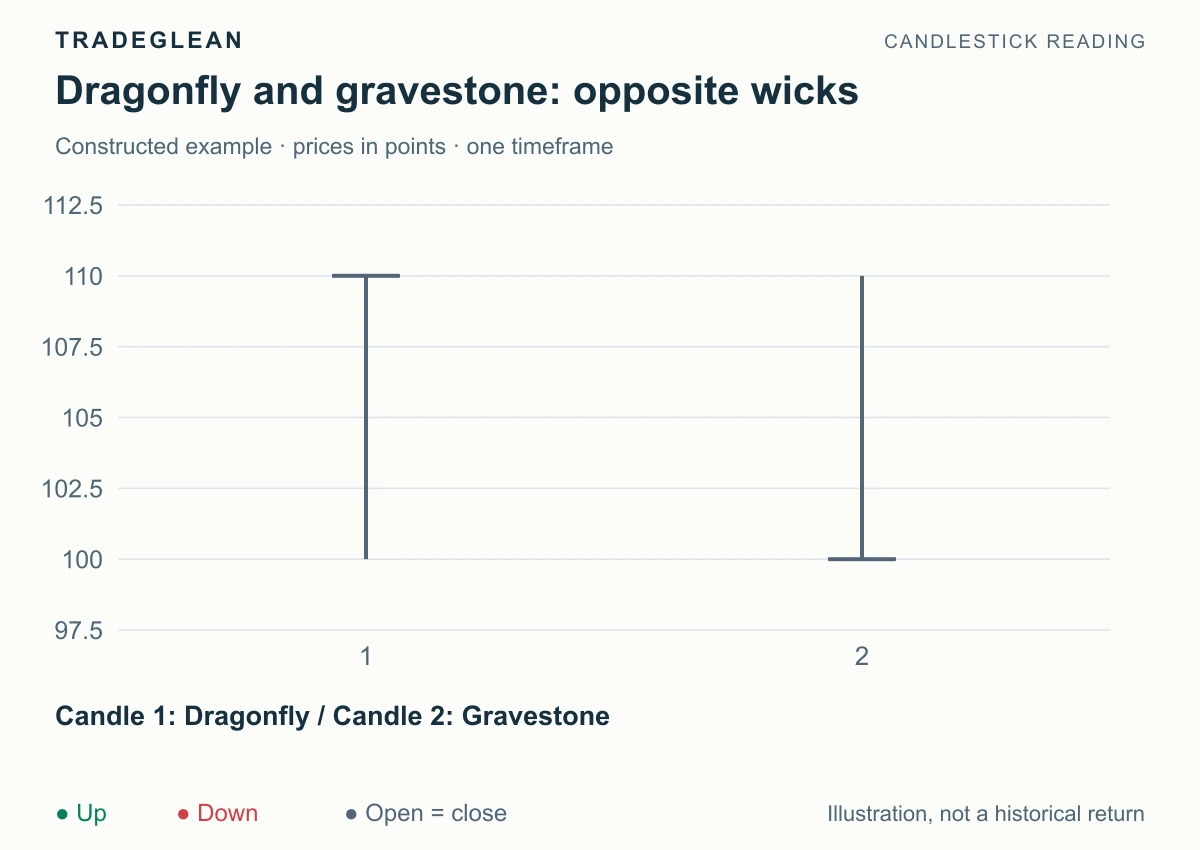
An inverted hammer has the shooting star's outline but follows a decline. A hanging man has the hammer's outline but follows a rise. The existing hammer vs. hanging man and inverted hammer vs. shooting star guides explain these same-shape pairs.
When recording a candidate, include all three observations: dominant wick, preceding move, and confirmation condition. For the examples here, that produces “red hammer after a decline; wait for a close above 200.2” and “green shooting star after a rise; wait for a close below 146.8.” Before acting on either, check the next obstacle and the planned stop distance and position size.
References
StockCharts: Introduction to Candlesticks describes conventional shapes, context, and the limits of OHLC. StockCharts: Bearish Reversal Patterns discusses shooting-star gaps and follow-through. All chart prices, calculations, and alternative outcomes above were constructed for this comparison; they are not a backtest or measured success rate.