Support and Resistance: Draw Zones You Can Explain
Use visible swing reactions to mark support and resistance, distinguish a touch from a rejection, and define when a level has failed.
A zone describes previous reactions
Support is an area where falling prices previously found a buying response. Resistance is an area where rising prices met a selling response. These levels organize the chart; they do not reveal every resting order or guarantee another turn.
A zone can be more honest than a single precise line when several nearby reactions differ slightly. Both CME and Fidelity describe how previous price reactions can become future reference areas.
Mark the reactions before the next approach
Start with one timeframe and the visible swings. A swing is a local turning point with price moving away on either side. Choose points visible before the setup you are evaluating; later candles cannot justify a level that was supposedly known earlier.
- Identify a low followed by a meaningful rebound, or a high followed by a meaningful decline.
- Compare the next separate reaction in that neighborhood.
- Mark the area containing the selected reactions and state whether its edges come from wicks or closes.
- Keep the nearest opposing zone visible so the available space is clear.
Two contacts are a useful starting convention for this example, not a universal requirement. Repeated touches do not prove that support grows stronger indefinitely; progressively weaker rebounds can show a change in the structure.
Read an upward response from support
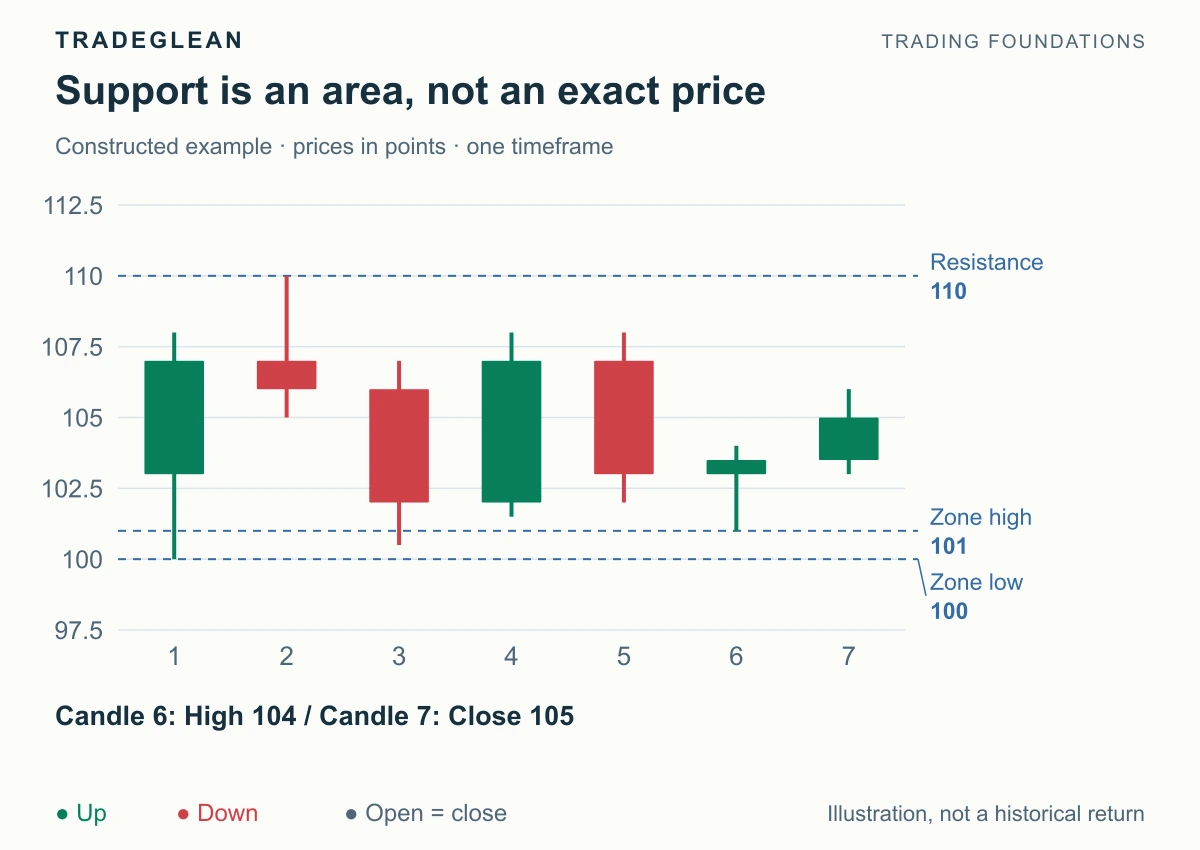
Constructed candles on one timeframe. The zone is known from earlier reactions; later candles show one possible response.
The earlier lows at 100 and 100.5 motivate an approximate 100–101 zone in this example; its upper edge is a stated allowance, not an earlier exact turning price. Candle 6 then tests 101 and has a high of 104. A later close at 105, above that high, is the upward trigger used in this illustration.
The touch of support and the upward trigger are separate events. If the next resistance starts at 110, an assumed entry at 105 leaves five points to that obstacle. A protective reference below 100 creates a different, larger risk distance. A valid-looking rejection is not automatically an attractive entry.
Know what a failed zone looks like
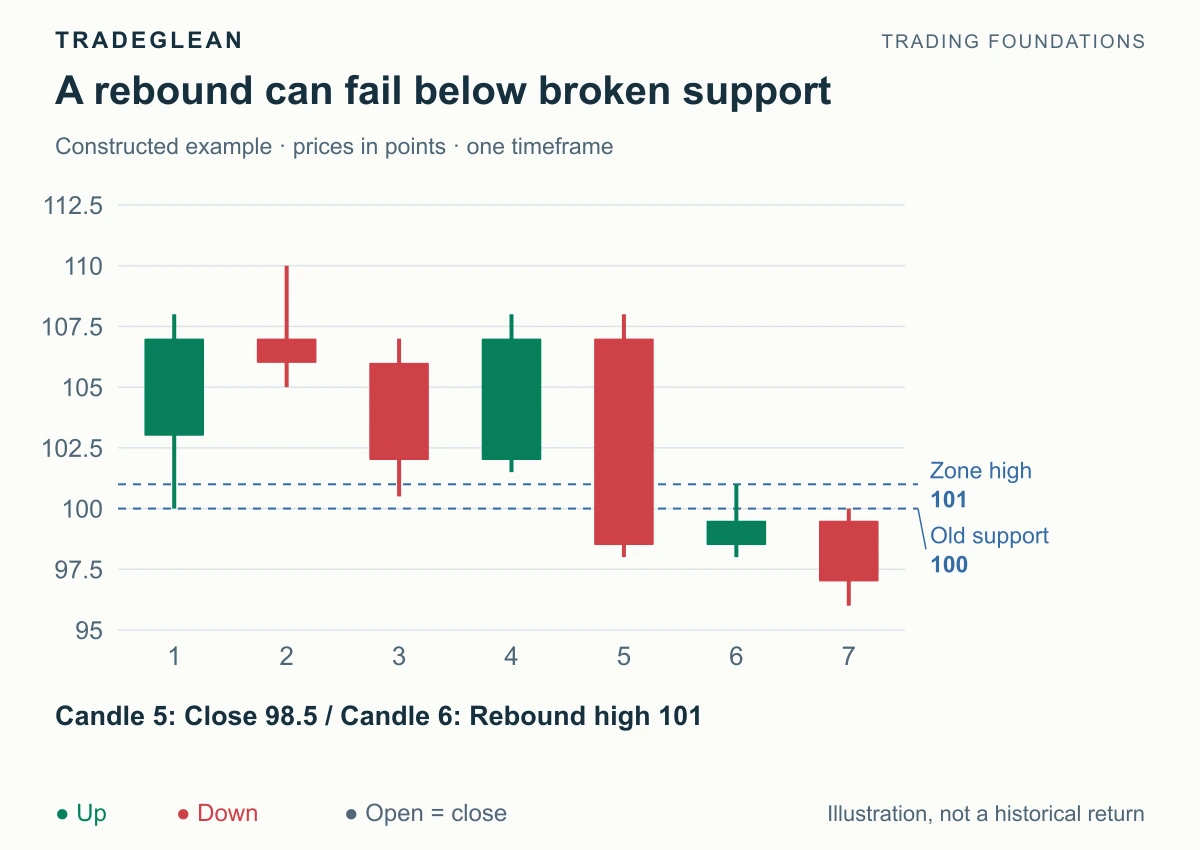
In this alternative outcome, price closes at 98.5, below the zone, and the rebound closes at 99.5 after reaching 101. The previous support has not been convincingly recovered. A later close at 97 supports the breakdown reading.
A brief wick below 100 followed by recovery is different from this sequence. Specify whether your method responds to a touch, a completed close, or a failed retest. A protective order may execute during the candle; waiting for a closing interpretation does not undo that fill.
Keep the level, entry, and stop distinct
The zone supplies context. The signal supplies an observable reaction. The trigger determines when the chosen method permits entry. The stop belongs to the premise being protected and should account for the product's price increments and execution conditions.
Avoid moving a zone simply to make the latest candle look successful. Likewise, do not tighten a structural stop solely to create a more attractive ratio. First define the price evidence, then calculate position size.
A former resistance area can become support after a break and successful retest, but the role change needs price evidence. Continue with trends versus trading ranges to see how the same level fits different market conditions.